Curated OER
Generating Points and Graphing
Students create a table of values to help them plot. In this algebra lesson, students plot their points on a coordinate plane creating a graph. They observe and analyze linear functions.
Curated OER
Graphing Integers
Fifth graders complete an integer graphing activity. In this integer graphing lesson, 5th graders use coordinate grids to help them complete linear functions and integer graphing.
Curated OER
Linear Functions
In this linear functions learning exercise, students define 5 terms. They solve 6 problems for the specified term. Students graph 3 linear equations. They write the equations for 14 problems using the given information. There are 28...
Curated OER
Linear and Quadratic Functions
In this algebra worksheet, 11th graders solve quadratic functions using the quadratic formula. They take the square roots of both side of each equation then graph both the linear and quadratic functions. There are a total of 84 problems...
Curated OER
Zeros of a Quadratic Function
Factor quadratic equations by teaching your students how to identify the zeros of the quadratic function. They use the TI to see where the graph will intercept the coordinate plane.
Curated OER
Linear and Exponential Models
Learners linearize data to determine if an exponential model is suitable. For this linearizing data to determine if an exponential model is suitable lesson, students graph the residuals of sets of data that appear to have an exponential...
Curated OER
Transformations and Exponential Functions
Tenth graders study graphing exponential functions. In this transformations lesson, 10th graders apply inquiry to determine how changes to a parent function affect its graph. Students analyze transformed graphs and generate the function...
Curated OER
Graphing at all Levels: It's a Beautiful Thing!
Mixing math and art is done in this lesson by applying graphing knowledge to create a unique piece of art. This lesson varies acording to the graphing knowledge of the artist. First, learners identify and review various types of graphing...
Curated OER
Graphing Linear Equations
Ninth graders review the information that they have already learned
with regard to linear equations and graphical representations. They then assist in combining equations with a graphical element and complete various graphs with this...
Curated OER
VARIABLES AND PATTERNS, USE AFTER INVESTIGATION THREE. DISCRETE OR CONTINUOUS LINEAR RELATIONS.
Students discover for which kind of linear function is appropriate to use the "scatter" or the "connected" term. In this lesson, students investigate functions using variables, patterns book, graph paper, rulers and the graphit program.
Curated OER
Functions
Learners explore a variety of functions. They recognize and describe functions and use linear functions to describe situations. Students find the domain and range of linear functions and graph rational expressions.
Curated OER
Graphing Linear Equations - With Table
Learners describe relations and graph linear functions. After studying a geometric shape and a verbal statement, students contrast the differences between the verbal statement and the picture. They determine functions and graph...
Curated OER
Reviewing the First Unit
In this linear function instructional activity, students explain how the linear function relates to direct proportionality. They answer questions dealing with slope fields, rate equations and illustrate Euler's Method. After answering...
Curated OER
Some Elementary Derivative Formulas and Rules
In this derivative formula worksheet, students solve problems concerning the derivative of constant functions and linear functions. They explore the derivative of the cosine and sums and differences functions. This six-page worksheet...
Curated OER
Rational Functions
Young scholars evaluate rational functions. In this precalculus lesson, students make observations and define what makes a rational function and what makes a linear function. They use the Ti calculator to visualize the different graphs.
Inside Mathematics
Sorting Functions
Graph A goes with equation C, but table B. The short assessment task requires class members to match graphs with their corresponding tables, equations, and verbalized rules. Pupils then provide explanations on the process they used to...
Rice University
Algebra and Trigonometry
Move on into trigonometry. An informative eBook takes the content of a College Algebra course and adds more relating to trigonometry and trigonometric functions. The content organization allows pupils to build upon their learning by...
Intel
Pedal Power
Show your classes the importance of mathematics in something as simple as bicycle design. The final lesson in the six-part STEM series has each group research a different aspect of the bicycle. Learners use mathematical formulas, linear...
Howard County Schools
Exponential Decay Exploration
How can you model exponential decay? Explore different situations involving exponential decay functions and decreasing linear functions by performing activities with MandM candy, popcorn kernels, and number cubes.
West Contra Costa Unified School District
Multiple Representations of Equations
class members first work through finding the equation, table of values, graph, and key features of a linear function expressed verbally. Individuals then work through several more problems given different representations.
Curated OER
Get a Half Life!: Student Worksheet
Upper elementary or middle schoolers will explore non-linear functions, graphing, and the curve of best fit through real-life data collection and trial analysis. They explore the concept of half-life and radioactive decay using M&Ms,...
Concord Consortium
Intersections II
How many intersections can two absolute value functions have? Young scholars consider the question and then develop a set of rules that describe the number of solutions a given system will have. Using the parent function and the standard...
CK-12 Foundation
Vertical Translations
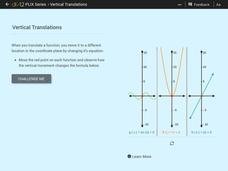
Change the y-intercept by adding a constant to the function. Individuals move three functions vertically along the y-axis. As they observe how the equation of the functions change with the vertical movement, learners determine how to...
101 Questions
Potty Math
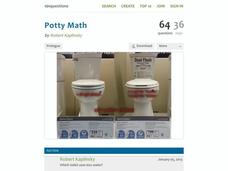
You don't want to flush your money down the drain! Have your classes complete a financial comparison between two different types of toilets. They use linear modeling to determine the most cost-effective model.
Other popular searches
- Graphing Linear Functions
- Linear Functions and Graphs
- Writing Linear Functions
- Nonlinear Functions
- Inverse Linear Functions
- Graphs of Linear Functions
- Nonlinear Equations
- Linear Functions Activity
- Linear Functions Math Models
- Linear Functions to Graph
- Linear Functions and Models
- Power Point Linear Functions


