Curated OER
Slopes and Linear Equations
Students find the slopes of linear functions. For this graphing lesson, students analyze linear equations and calculate the slope of the line. They graph a line given the slope and y-intercept.
Curated OER
Move It
Studens collect and graph data. In this algebra lesson, students use a CBL and CBR with a TI Calcualtor to observe linear graphs. They use the correct vocabualry as they discuss the collected data.
Curated OER
Graph Dynamic Linear Equations
Students explore the concept of linear equations. In this linear equation lesson, students change parameters of an equation and notice the effect it has on its graph.
Curated OER
Linear Equations Project Fram
Students engage in a instructional activity that focuses on the concept of linear equations. They practice solving problems with a variety of problems and graphing the solution set for each. Students write a summary paragraph about two...
Curated OER
It's a Drag!
Students create number lines using decimals and whole numbers. In this algebra lesson, students graph and solve linear equations. They plot ordered pairs on a coordinate plane correctly.
Curated OER
Population and Food Supply
What does it mean for something to grow exponentially, and how does that compare to linear growth? This activity tries to help learners gain an understanding of these concepts while modeling real-world problems. Linear and exponential...
Curated OER
Comparing Linear and Exponential Functions
Teach your class how to differentiate between linear and exponential functions. They use exponential properties to solve problems, graph them using the TI-Navigator, and make comparisons.
Curated OER
Comparing Linear and Exponential Data
Students graph linear and exponential equations. In this algebra lesson, students differentiate between linear and exponential equations. They relate it to the real world.
Curated OER
Local Linearity
In order to investigate local linearity, young scholars graph the function on the TI-calculator and zoom to observe the change in slope on the line. They incorporate technology to visualize these problems.
Curated OER
Be Direct - Oil Spills on Land
Students participate in an activity to simulate direct variation. In this oil spills on land lesson, students participate in a simulation using toilet paper and vegetable oil to explore the characteristics of direct variation. They...
Curated OER
Mathematics of Doodles
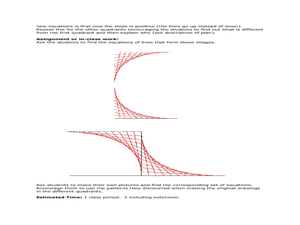
Students use the slope and y-intercept to graph lines. In this algebra lesson, students graph linear equations and apply it to solving real life problems.
Curated OER
Function or Not a Function
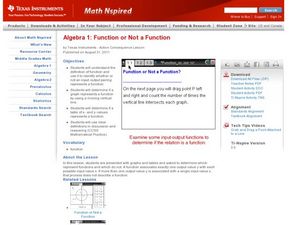
Graphing linear equations on the TI is easy! Through examination of graphs and identification if it is a function or not, this lesson can relate to the real world.
Curated OER
Equations and Functions
In this algebra worksheet, learners solve linear equations and write them in the y-intercept form. They evaluate and solve equations. There are 10 questions with an answer key.
Curated OER
Exponential Growth
Learners study exponential functions. In this exponential growth lesson, students conduct a simulation in which a population grows at random but predictable rate. Learners compare and contrast linear and exponential functions. Students...
Curated OER
Exponential Growth and Exponential Functions
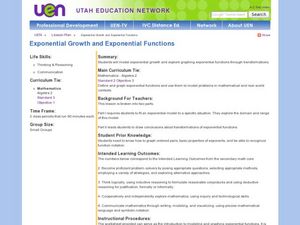
Young scholars explore the concept of exponential functions. For this exponential functions lesson, students model exponential growth about a high school population using an applet. Young scholars manipulate the applet to show the effect...
Curated OER
Linear Patterns in Data
Eighth graders extend their learning of graphing linear equations and are introduced to connecting patterns in tables and graphs to represent algebraic representations. They then determine patterns and extrapolate information from these...
Curated OER
The Function Elevator
Students solve and graph functions. In this precalculus lesson plan, students use piecewise function to relate real life scenarios. They analyze the graphs and identify the vertex and intercepts.
Curated OER
Count the Differences
Pupils find the difference between consecutive y-values on the calculator and write an equation that fits the data. They continue finding the differences in consecutive y-values using lists on their calculator. Learners conclude as they...
Curated OER
Numerical Analysis: Systems of Linear Equations
In this linear equation worksheet, students use the iterative method to solve systems of equations. Explanations and examples are provided. This four-page worksheet contains approximately three problems.
Curated OER
Reciprocals of Quadratic Functions
Eleventh graders investigate inverse functions. In this Algebra II lesson, 11th graders use their prior knowledge of linear, exponential,and quadratic functions to create a graph of an equation they have never seen before.
Curated OER
Linear Equations
For this algebra worksheet, student linear equations through addition, subtraction, multiplication and division. They check their work algebraically. There are 26 problems.
Curated OER
Linear Systems
Students solve and graph linear equations. In this algebra lesson, students solve systems of equations using elimination and substitution. They graph their answer and identify the point of intersection.
Curated OER
Impossible Graphs
Middle schoolers practice plotting functions on the Cartesian coordinate plane while participating in a discussion about the Possible Or Not worksheet/activity. Students also use the Impossible Graphs worksheet to practice reading a...
Rice University
College Algebra
Is there more to college algebra than this? Even though the eBook is designed for a college algebra course, there are several topics that align to Algebra II or Pre-calculus courses. Topics begin with linear equation and inequalities,...
Other popular searches
- Graphing Linear Functions
- Linear Functions and Graphs
- Writing Linear Functions
- Nonlinear Functions
- Inverse Linear Functions
- Graphs of Linear Functions
- Nonlinear Equations
- Linear Functions Activity
- Linear Functions Math Models
- Linear Functions to Graph
- Linear Functions and Models
- Power Point Linear Functions


