Curated OER
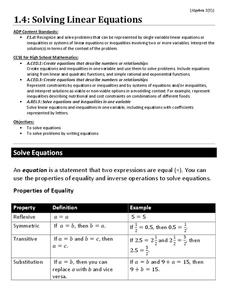
Solving Linear Equations
Use this worksheet for practice or review solving linear equations in one variable. Problems range from multiple-step problems involving parentheses and combining like terms, to word problems, to equations with no solution or infinitely...
Curated OER
Who Shares My Function? Linear with All Representations
Students investigate and interpret functions and graphs. In this algebra instructional activity, students analyze equations, graphs and word problems to differentiate between quadratic functions and linear equations. They create a poster...
Curated OER
Algebra I - Test
Students participate in a lesson that reviews the concept of linear functions in connection with preparation for an exam. The teacher reviews problems with the students for scaffolding. Students practice graphing linear functions.
Curated OER
Numerical Analysis
In this math learning exercise, students use fzero to find the roots of the non-linear functions. They also practice finding the root of the polynomial functions.
Curated OER
Who Shares My Function?
Students differentiate between linear and quadratic functions. For this algebra lesson, students write equations of graphs and graph a function from an equation. They also move the graph around on the coordinate plane.
Curated OER
Slope Intercept Form
In this slope intercept form worksheet, students solve and graph 6 different problems that include identifying the slope and intercepts in each graph. First, they determine the line that has a given x-and y-intercept. Then, students find...
Inside Mathematics
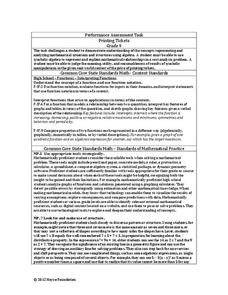
Printing Tickets
Determine the better deal. Pupils write the equation for the cost of printing tickets from different printers. They compare the costs graphically and algebraicaly to determine which printer has the best deal based upon the quantity of...
Curated OER
US Population 1982-1988
Your algebra learners make predictions using the concepts of a linear model from real-life data given in table form. Learners analyze and discuss solutions without having to write a linear equation.
Curated OER
Sandia Aerial Tram
Your learners analyze a table of real-life data in order to write an equation that best models the information. Exponential, quadratic, and linear rates of changes are all possibilities in this task.
EngageNY
Modeling a Context from a Verbal Description (part 1)
When complicated algebraic expressions are involved, it is sometimes easier to use a table or graph to model a context. The exercises in this lesson are designed for business applications and require complex algebraic expressions.
Virginia Department of Education
Determining Direct Variation
Once learners realize what direct variation is, they see it's just a type of linear function. The activity poses a general question that leads to the creation of the y = kx formula. The resource includes discussion prompts and ideas for...
Mathalicious
Out of Left Field
A baseball trajectory and a parabola seem to make the best pair in real-world quadratic applications. Here is a current baseball resource with questions, discussions, and explorations regarding a quadratic function and home run...
Illustrative Mathematics
Oakland Coliseum
Help algebra learners relate a real-life function that happens at the Oakland Coliseum every time the Raiders play. The resource states that the revenue of the Oakland Raiders home games is a function of the number of seats sold and the...
GeoGebra
GeoGebra Graphing Calculator
So, exactly, what does it look like? The easily usable graphing calculator allows pupils to visualize the graph of equations and inequalities. The interactive supports any algebraic graph needed for high school mathematics and then some.
Alabama Learning Exchange
Explore the Transformations of Linear and Absolute Value Functions Using Graphing Utilities
Pupils explore the concept of transformations. For this transformation lesson, students use an applet that is an interactive absolute value graph applet. Pupils manipulate the applet to examine the change in the function and how it...
Curated OER
Numerical Analysis: Introduction to Approximation Theory
In this introduction to approximation theory, students compute the slope and intercept of a line. They describe nonlinear relationships. This four page worksheet contains approximately five problems.
Curated OER
Beginning the Year with Local Linearity
Students investigate an article on local linearity. In this calculus instructional activity, students read about the application of math in the real world. They gain insight from the teachers view of how to teach and relate the topic to...
Curated OER
Spreadsheet Function Machine
Young scholars create a spreadsheet to analyze functions. In this algebra lesson, students use spreadsheets to find the intersection of systems of equations. They identify the dependent and independent function as it relates to a line.
Illustrative Mathematics
Baseball Cards
Here is a resource that demonstrates growth and the initial state of an equation. In this case, your class will be looking at baseball collections. How many baseball cards did the collector start out with, and how many were added or...
Curated OER
Intersecting Graphs
Ninth graders know how to solve a system of linear equations, but what happens when the system involves an exponential function? The instructional slideshow teaches viewers to determine solutions to systems of equations with linear and...
Curated OER
Introducing y = mx + b
Middle and high schoolers use the slope intercept form to graph a line. In this algebra lesson, pupils rewrite equations from standard form to y-intercept form. They use the slope and y-intercept to graph a line without making a table of...
Curated OER
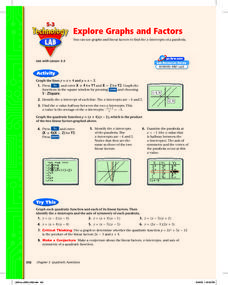
Explore Graphs and Factors
Pupils graph the factors of a quadratic as linear equations and graph the parabolic equation in factored form. Also, they investigate the relationship between the x-intercepts of the lines and the zeros of the parabola.
Curated OER
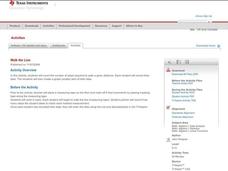
Walk the Line
Learners create constant speed versus motion graphs. They will perform linear regressions on their data to describe the graphs mathematically.
Curated OER
Let's Gather Around the Circle
Scholars explore the relationship between circumference and diameter. Groups of learners measure the diameter and circumference of round objects and record their data on a given worksheet. They then input the data into their graphing...
Other popular searches
- Graphing Linear Functions
- Linear Functions and Graphs
- Writing Linear Functions
- Nonlinear Functions
- Inverse Linear Functions
- Graphs of Linear Functions
- Nonlinear Equations
- Linear Functions Activity
- Linear Functions Math Models
- Linear Functions to Graph
- Linear Functions and Models
- Power Point Linear Functions


