Radford University
Create A Ramp Design
Ramp up a design challenge. Class members design ramps to meet a client's requirements to comply with the American with Disabilities Act. The scholars create a scaled graph of their designs and determine the equations of the lines on...
Curated OER
Taxi!
Your young taxi drivers evaluate and articulate the reasoning behind statements in a conceptual task involving linear data. The given data table of distances traveled and the resulting fare in dollars is used by learners to explore...
Mathematics Assessment Project
Shelves
Don't leave this task on the shelf — use it is assess middle schoolers understanding of patterns. Participants try to discover a pattern in the number of bricks and planks used to make shelves. They then match descriptions and equations...
Project Maths
Integral Calculus
From derivatives to antiderivatives and back again. Building on the second lesson of the three-part series covering functions, learners explore the concept of an antiderivative. They connect the concept to the graph of the function and...
EngageNY
Successive Differences in Polynomials
Don't give your classes the third degree when working with polynomials! Teach them to recognize the successive differences and identify the degree of the polynomial. The lesson leads learners through a process to develop an understanding...
EngageNY
Two Graphing Stories
Can you graph your story? Keep your classes interested by challenging them to graph a scenario and interpret the meaning of an intersection. Be sure they paty attention to the detail of a graph, including intercepts, slope,...
Mascil Project
Closed Greenhouses
Controlling the efficiency of a greenhouse is a mathematical task. A collaborative project challenges learners to create an efficiency plan for a closed greenhouse. Using algebraic equations, they consider a set of constraints, design...
Concord Consortium
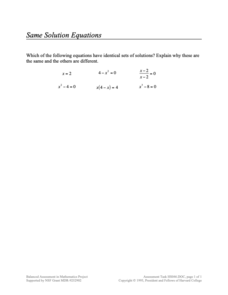
Same Solution Equations
Group equations by their solutions. Given six different equations, pupils determine which have the same solutions. Scholars explain why some are the same and some are different.
Flipped Math
Sequences
Develop a sequence of descriptions. Learners watch an introduction to sequences, their notations, and how to graph them. Pupils use full sentences to describe the sequence and how to get from one term to the next, without needing to...
Ms. Amber Nakamura's Mathematics Website
Algebra Project
What would your dream house look like? A cottage? A medieval castle? High schoolers enrolled in Algebra design the perfect house while using slopes to write equations for various aspects of the project.
Virginia Department of Education
Factoring for Zeros
Relate factors to zeros and x-intercepts. Scholars first graph quadratics in both standard and factored forms to see that they are the same. They go on to use the graphs to see the relationship between factors and x-intercepts.
Curated OER
Slopes of Lines
Students examine a graph and relate it to the real world situation it depicts. They investigate changes in an equation and the appearance of a line. They investigate the connection between the graph of a situation and the meaning of the...
Curated OER
Baseball Relationships - Using Scatter Plots
Students use graphing calculators to create scatter plots of given baseball data. They also determine percentages and ratios, slope, y-intercepts, etc. all using baseball data and statistics.
Curated OER
Linear Equations
In this Algebra I/Algebra II worksheet, learners write the equation of a line given the coordinates of two points on the line. The one page worksheet contains a combination of three multiple choice and free response questions. Answers...
Curated OER
Perfect Shuffles
Students investigate piecewise functions. For this algebra lesson, students model piecewise functions in the real world. They graph the parts of the functions following the restrictions of the domain.
Curated OER
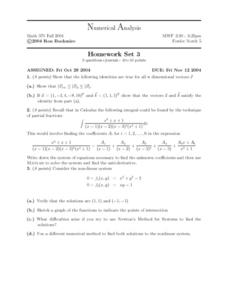
Numerical Analysis: Dimensional Vectors
For this dimensional vector worksheet, students prove dimensional vectors. They write systems of equations, verify solutions, and sketch graphs of the functions. This two-page worksheet contains approximately ten problems.
Curated OER
Computing Derivatives
In this computing derivatives worksheet, students determine the derivative, slope, and rate of change in a function. They indicate if a function is constant, increasing, or decreasing. This two-page worksheet contains approximately ten...
Curated OER
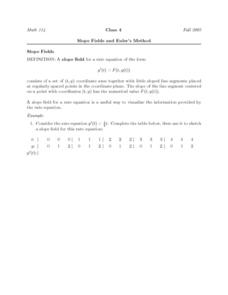
Slope Fields and Euler's Method
For this slope field worksheet, students use a slope field for a rate equation. Using Euler's Method, they identify the piecewise linear function approximating the solution of the initial value problem. This four-page worksheet...
Curated OER
Successive Approximations and Euler's Method
In this Euler's method worksheet, students compute the successive approximations for a given function. They compute the piecewise linear function to produce the approximation to the solution of the initial value problem. This four-page...
Curated OER
Relating Distance and Velocity Over Time
Students calculate the distance and velocity over time. In this algebra lesson, students graph a linear function to represent the distance vers time travel. They interpret their graphs and draw conclusion.
Curated OER
Rate Equation
In this rate equation learning exercise, students use Euler's method to estimate the value of rate equations. They use the piecewise linear function approximation to determine the solution of an initial value problem. This two-page...
Curated OER
Lesson Plan On Fran Data
Seventh graders investigate the concept of functions and how they are used in the context of the real world while identifying the dependent and independent variables. They graph relations and functions and find the zeros of functions....
Curated OER
Introduction To Data Analysis
Seventh graders investigate the concept of looking at the data put in a variety of ways that could include graphs or data sets. They analyze data critically in order to formulate some sound conclusions based on real data. Students graph...
Curated OER
Mine Lesson #1: Slope slider
Eighth graders investigate linear equations. In this Algebra I lesson plan, 8th graders explore the effects that manipulating a linear equation has on the graph of the function through the use of a java applet.
Other popular searches
- Graphing Linear Functions
- Linear Functions and Graphs
- Writing Linear Functions
- Nonlinear Functions
- Inverse Linear Functions
- Graphs of Linear Functions
- Nonlinear Equations
- Linear Functions Activity
- Linear Functions Math Models
- Linear Functions to Graph
- Linear Functions and Models
- Power Point Linear Functions


