CK-12 Foundation
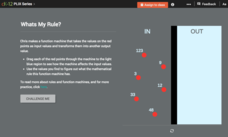
Function Rules for Input-Output Tables: Whats My Rule?
What's the rule that makes it true? A virtual function machine generates output values as learners submit the input values. Their job is to analyze the inputs and outputs for a pattern and write a function rule.
Curated OER
Polynomials Functions
High schoolers factor polynomials and linear functions and apply concepts of the fundamental theorem of algebra to solve problems. They graph their solutions and analyze the graph.
Mathematics Vision Project
Module 4: Linear and Exponential Functions
Sequences and series are traditionally thought of as topics for the pre-calculus or calculus class, when learners are figuring out how to develop limits. But this unit uses patterns and slopes of linear functions in unique ways to bring...
EngageNY
Representations of a Line
Explore how to graph lines from different pieces of information. Scholars learn to graph linear functions when given an equation, given two points that satisfy the function, and when given the initial value and rate of change. They solve...
Curated OER
Interactivate: Introduction to Functions
This interactive website provides a variety of lesson plans according to which standards you are applying and which textbook you use. Introduce functions to your class by having them construct single operation machines and create...
Charleston School District
Sketching a Piecewise Function
How do you combine linear and nonlinear functions? You piece them together! The lesson begins by analyzing given linear piecewise functions and then introduces nonlinear parts. Then the process is reversed to create graphs from given...
Chicago Teachers Union Quest Center
Factored Form of a Quadratic Function
Build upon linear functions to learn about quadratics. The lesson introduces the concept of zeros for quadratic functions and makes the connection to the linear factors of the function. It presents quadratics in both graphical and...
Curated OER
Sets, Relations, and Functions
Sets, relations, functions, and graphing linear equations are practiced in this challenging worksheet. The class determines if a relation is a function or not and find the functional value of a domain element. The one page worksheet...
Charleston School District
Graphing Functions
How do letters and numbers create a picture? Scholars learn to create input/output tables to graph functions. They graph both linear and nonlinear functions by creating tables and plotting points.
Flipped Math
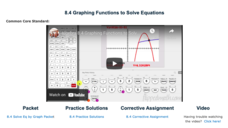
Graphing Functions to Solve Equations
Intersections become solutions. Scholars watch a video on using a graphing calculator to find the solution to an equation in one variable. While watching the presentation, pupils practice working some of the examples and compare their...
Illustrative Mathematics
Velocity vs. Distance
At the end of this activity, your number crunchers will have a better understanding as to how to describe graphs of velocity versus time and distance versus time. It is easy for learners to misinterpret graphs of velocity, so have them...
Radford University
Linear Equations in Real Word Problems
Make up a story about a linear graph. Scholars identify key features of a linear graph, such as intercepts, domain and range, and slope. They then create a word problem that could be represented by the graphed line.
CK-12 Foundation
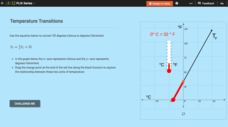
Linear Equations: Temperature Transitions
Explore linear conversions using an engaging interactive lesson. Learners drag a point on a graph to discover the equivalent degrees in Fahrenheit and Celsius. Embedded questions highlight key features such as slope and the y-intercept.
Curated OER
How Dense is Salt Water?
Young schoolers explore the concept of linear regression. They determine the mass and density of salt water. Pupils add salt to water and record the density as salinity increases, and perform a linear regression on the data to model the...
Curated OER
Linear Functions
Students solve and graph linear equations. For this algebra lesson, students collect data and plot it to create a linear function. They identify the domain and range of each line.
Curated OER
Linear and Exponential Models
Students investigate the differences between linear and exponential models. In this linear and exponential models lesson, students make a table of given data. Students determine if the data is linear or exponential by plotting the data...
Curated OER
Functions and the Vertical Line Test
Students examine functions and function notation. They use computer activities to discover how to graph functions, and conduct a vertical line test. Students describe spatial relationships using coordinate geometry.
Curated OER
Products of Linear Functions
Students investigate the horizontal intercepts of functions. In this algebra lesson, students identify whether the factor of two functions results in a quadratic equation or not. They compare and contrast linear equations and higher...
Curated OER
Iterating Linear Functions
Students use a spreadsheet to investigate data. In this algebra instructional activity, students collect and graph data on a coordinate plane. They explain properties of a linear equation both algebraically and orally.
Curated OER
Reflections of a Linear Function
Learners reflect functions about the X-axis, Y-axis, and origin. They derive equations for reflected functions using the website www.explorelearning.com.
Curated OER
Quadratic and Linear Functions
In this Algebra II activity, 11th graders review and apply the basic concepts for solving linear and quadratic equation. The one page activity contains twelve problems. Solutions are not provided.
Curated OER
Graphing and Interpreting Linear Equations in Two Variables
Graph linear equations using a table of values. Learners solve equations in two variables using standard form of an equation. They identify the relationship between x and y values.
EngageNY
Linear and Exponential Models—Comparing Growth Rates
Does a linear or exponential model fit the data better? Guide your class through an exploration to answer this question. Pupils create an exponential and linear model for a data set and draw conclusions, based on predictions and the...
EngageNY
Modeling Linear Relationships
Math modeling is made easy with the first installment of a 16-part module that teaches pupils to model real-world situations as linear relationships. They create graphs, tables of values, and equations given verbal descriptions.
Other popular searches
- Graphing Linear Functions
- Linear Functions and Graphs
- Writing Linear Functions
- Nonlinear Functions
- Inverse Linear Functions
- Graphs of Linear Functions
- Nonlinear Equations
- Linear Functions Activity
- Linear Functions Math Models
- Linear Functions to Graph
- Linear Functions and Models
- Power Point Linear Functions


