Curated OER
Get a Half-life!
Students explore decay functions and the half-life of a substance. Through an M&M activity with calculators, students collect and graph data. They determine the linear, quadratic and exponential functions of the graph. Students...
Curated OER
What's Its Slope
Young scholars identify the slope of a lines.In this algebra instructional activity, students define the meaning of slope and write an equation given the slope. They graph linear functions using the slope and y-intercept.
Curated OER
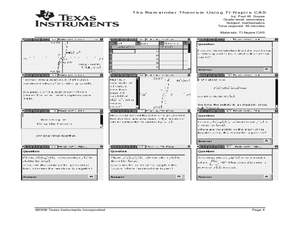
The Remainder Theorem Using TI-Nspire CAS
Investigate the Remainder Theorem in this algebra lesson plan. Explore the relationship between the remainders of polynomial division and the function. Each of the four problems gets progressively more complicated. This might be a great...
Curated OER
Get a Half-Life Student Worksheet
Young scientists use a worksheet to help them perform a lab on the decay of a radioactive element. The worksheet serves as both a task guide and a lab sheet for pairs of learners. This activity requires a calculator and has excellent...
Curated OER
Sondheim: Secret Metaphors
Students explore the work of Stephen Sondheim. In this musical theater lesson, students examine the musicals Merrily We Roll Along and Sunday in the Park with George. Students identify and anaylze linear and nonlinear structural patterns...
Curated OER
What's My Pattern?
Students recognize, describe and extend patterns in three activities. They organize data, find patterns and describe the rule for the pattern as well as use the graphing calculator to graph the data to make and test predictions. In the...
Curated OER
Make a Pass at Me
Students identify different types of functions and units of measurements. In this statistics lesson plan, students will collect data, graph their data and make predictions about their data. They plot a linear regression graph.
Curated OER
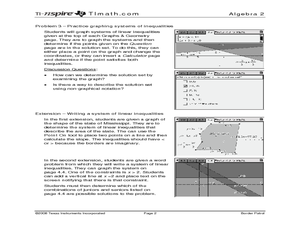
Border Patrol ID: 11603
Incorporate technology in your classroom by teaching your students how to graph systems of linear inequalities as they apply to an area of land. The lesson provides an extension in which students are challenged to write a system of...
Curated OER
Get a Half-Life!: Student Worksheet
In this math/science worksheet, students will work in pairs to conduct an experiment based on a decay function which is often used to model radioactive decay. Students will shake M & M's in a cup to rub off the M and then record...
Curated OER
How Does Your Population Grown?
Do you know how the population has grown of your community? Can you predict the population over the next half century? Can we find an algebraic model that matches our data? These along with many more questions can be researched by...
Concord Consortium
"Equal" Equations
Different equations, same solution. Scholars first find a system with equations y1 and y2 that have a given solution. They then find a different system with equations y3 and y4 that have the same solution. The ultimate goal is to...
5280 Math
Triangle Area Patterns
Combine algebraic and geometric strategies to find solutions. The task asks learners to find the coordinates of a third vertex of a triangle to create a triangle with a specific area. The project is a set of seven problems that helps...
Center Science Education
The Nitrogen Cycle Game
Earth science experts learn about the roles of nitrogen by taking a virtual journey through the nitrogen cycle. Completing a passport worksheet along the way, they move from place to place around the classroom by the toss of dice. Each...
Curated OER
Guess the Age
Students describe graphically, algebraically and verbally real-world phenomena as functions; identify the independent and the dependent variable. They translate among graphic, algebraic, and verbal representations of relations and graph...
Curated OER
I Can Do This! Systems of Equations
Students solve systems of 2-by-2 linear equations using tables,
graphs and substitution. In small groups, classmates work together to discover strategies for solving equations. They use a calculator to graphically represent their answers.
Curated OER
Vertical and Horizontal Translations
Pupils analyze function graphs. In this Algebra II/Pre-calculus lesson, students investigate the graph of a function as they determine to which family of functions it belongs, determine the parent function and describe the translation...
Curated OER
Earthquakes
Eighth graders demonstrate the mathematical components of a scientific problem as well as illustrate how real world problems can be solved using math. They demonstrate math skills such as rate calculation, graphing, and linear equations.
Curated OER
Literal Equations
Young scholars explore Literal Equations. In this literal equations lesson, students use the Internet to connect to links and solve linear equations. Young scholars investigate, analyze and record their findings on various activity...
Curated OER
Graphing Systems at the Races
Learners investigate systems of equations as they use the Ti-Navigator to explore scenarios about dog races and NASCAR races. Pupils determine the winner of the race and when opponents pass each other given a speed and distance.
Curated OER
Monopoly Graphs
Students relate the concepts of linear functions to the game of monopoly. In this algebra lesson plan, students solve problems with ratio and proportion. They collect data and graph it.
Curated OER
Pedal Power
Employ proportional reasoning and algebraic understanding to a determine a real world math quandary. Intel has created a project based unit to engage learners in using algebra to describe the physical world. They will create equations,...
Curated OER
Urban Ecosystems 4: Metabolism of Urban Ecosystems
Cities are compared to living, breathing, metabolizing organisms. Fourth in a five-part series of lessons, this one focuses on the flow of materials through a city. Links to interesting websites and images make your delivery of...
Curated OER
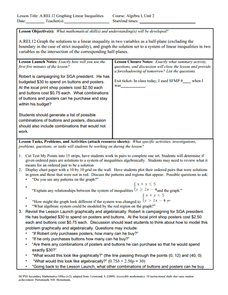
Graphing Linear Inequalities
Eighth graders extend skills for representing and solving linear equations to linear inequalities. Lesson activities build understanding and skill by plotting ordered pairs of numbers that either satisfy or do not satisfy a given...
Curated OER
Discovering the Linear Relationship between Celsius and Fahrenheit
Middle schoolers discover the linear relationship between degrees Farenheit and degrees Celsius. They manually compute the slope and y-intercept of the line passing through points. They convert Celsius to Fahrenheit degrees.


