Math Open Reference
Math Open Reference: Cubic Function Explorer
Learn about cubic functions with this helpful reference tool. Provides a detailed definition, examples, and an interactive activity that enhances further explanation. Includes links to related topics.
Oswego City School District
Regents Exam Prep Center: Slopes and Equations of Lines
Explanation of linear equations and four types of slopes: positive, negative, zero, and undefined. Practice problems for the students are provided and a reinforcement activity using a graphing calculator is offered for the teacher's use.
Curated OER
Linear Functions
This site contains a short tutorial on point-slope, slope-intercept, and general form of linear equations. The site has an interactive graph of lines showing how the graph of a line changes when values of the linear equation change.
Texas Instruments
Texas Instruments: Wrapping It All Up
Students recognize the effects of changes in parameters on the graphs of linear, quadratic, and exponential functions.
Ministry of Education and Universities of the Region of Murcia (Spain)
Ministerio De Educacion Y Ciencia: Funciones: Expresion Grafica Y Verbal
In Spanish. Interpret the graph of linear and non linear functions with this interactive activity.
Texas Instruments
Texas Instruments: The Study of Slope
This is a PROGRAM that can be used on any TI-8X+ There are 6 levels that takes the students through the process of checking their ability to recognize slope, calculate slope, form linear functions that satisfy given information.
Texas Instruments
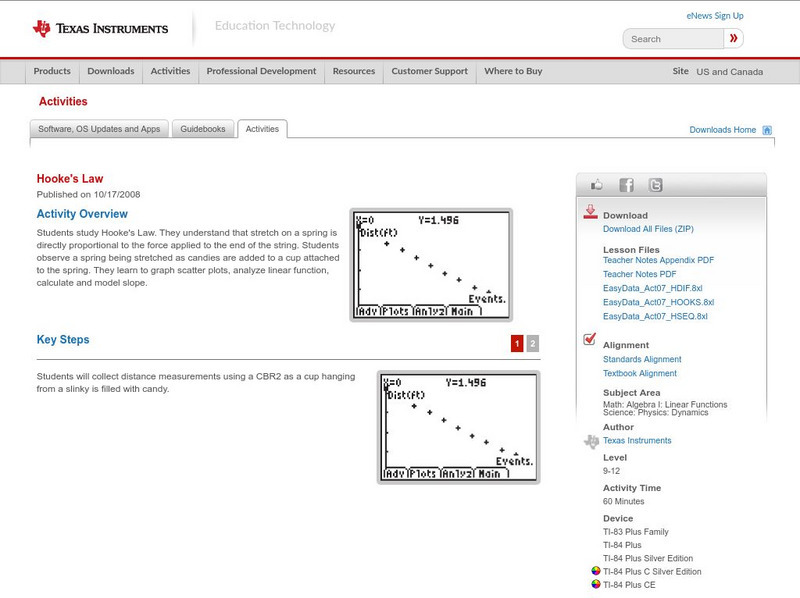
Texas Instruments: Hooke's Law
In this activity, students study Hooke's Law. They understand that stretch on a spring is directly proportional to the force applied to the end of the string. Students observe a spring being stretched as candies are added to a cup...
Texas Instruments
Texas Instruments: Getting Started With the Ti Navigator: If the Line Fits
This lesson introduces students to Activity Center and introduces students to the use of symbolic algebra to represent real world situations. They will use Activity Center to contribute equations that model a linear relationship and then...
Texas Instruments
Texas Instruments: Tight Rope
In this activity, students examine quantities that are linearly related and can be visually represented using a straight-line graph. Students collect distance versus time data using a motion detector and find a model for the...
Texas Instruments
Texas Instruments: Getting Started With the Ti Navigator: Exploring Change
This activity introduces students to Activity Center. In this activity, students will explore change in the context of cellular telephone charges. Students will create a scatter plot showing that the rate per minute for a "pay as you go"...
Texas Instruments
Texas Instruments: Warming Up to Heating Curves
In this activity, students use the CBL 2 to collect temperature data as a sensor warms up in a cup of water. They find an appropriate mathematical model for the resulting data set.
Texas Instruments
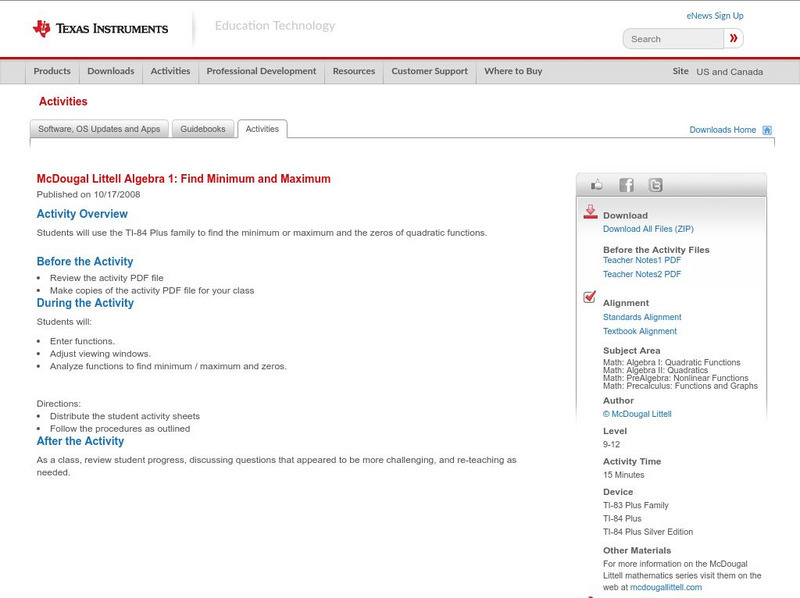
Texas Instruments: Mc Dougal Littell Algebra 1: Find Minimum and Maximum
Students can use the TI-84 Plus family to find the minimum or maximum and the zeros of quadratic functions.
Texas Instruments
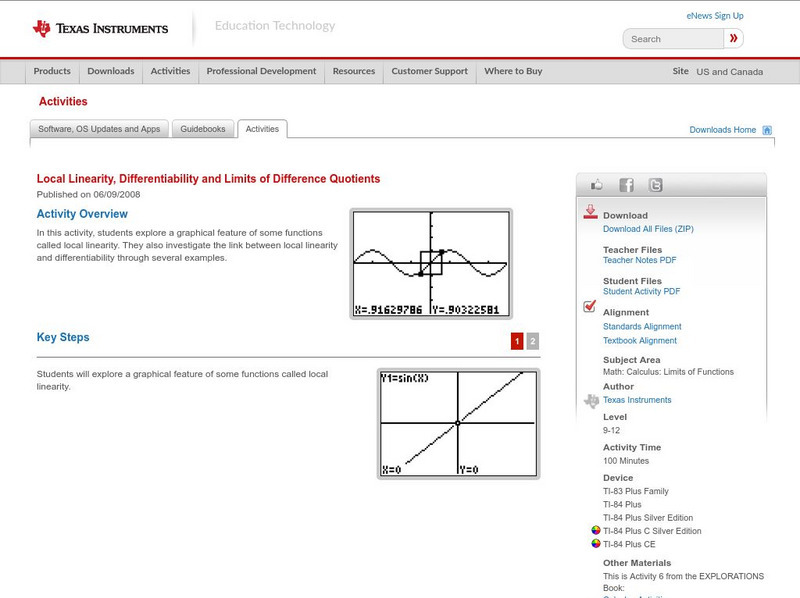
Texas Instruments: Local Linearity and Differentiability
In this activity, students explore a graphical feature of some functions called local linearity. They also investigate the link between local linearity and differentiability through several examples.
Texas Instruments
Texas Instruments: Velocity Test: Interpreting Velocity Graphs
In this activity, students' will use a motion detector to record the distance versus time data for the simple motion of a walker. They will calculate velocity from this graph and compare it with the velocity graph generated by the...
Texas Instruments
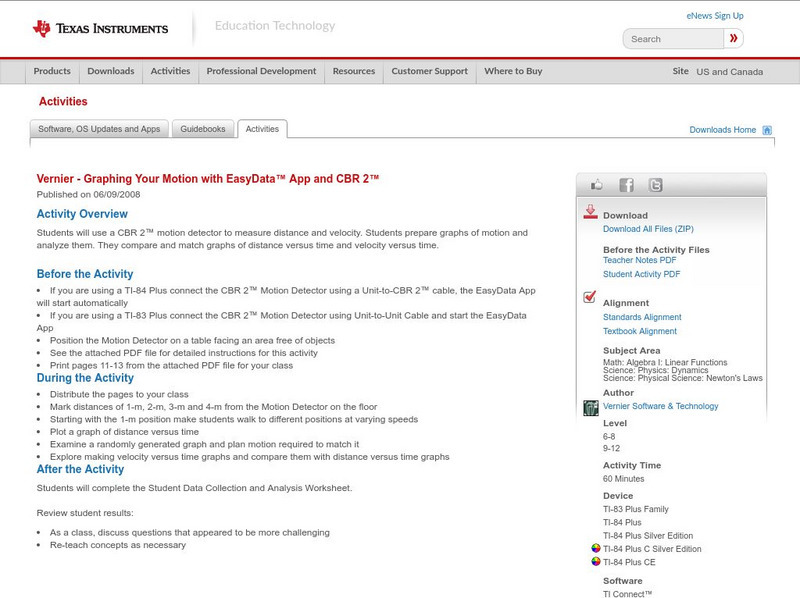
Texas Instruments: Graphing Your Motion With Easy Data App and Cbr 2
Students can use a CBR 2 motion detector to measure distance and velocity. Students prepare graphs of motion and analyze them. They compare and match graphs of distance versus time and velocity versus time.
Texas Instruments
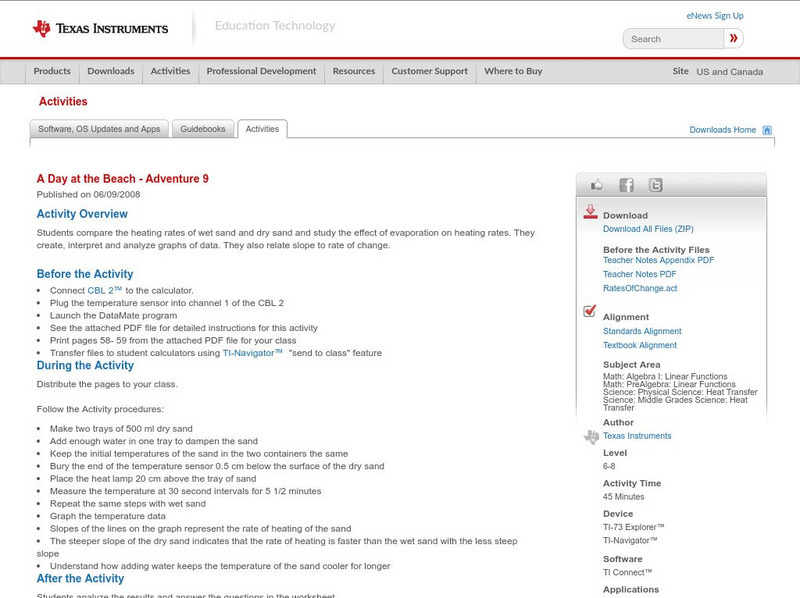
Texas Instruments: A Day at the Beach Adventure 9
Students compare the heating rates of wet sand and dry sand and study the effect of evaporation on heating rates. They create, interpret and analyze graphs of data. They also relate slope to rate of change.
Texas Instruments
Texas Instruments: A Sweet Drink Adventure 7
Students determine how the temperature of water affects the dissolving time of a sugar cube. They create, interpret and analyze graphs of data, find an equation of the line of best fit, and relate slope to rate of change.
Texas Instruments
Texas Instruments: Ti 73 and Cbl in Data Collection
Using the TI 73 and CBL to collect samples of water for temp, pH, etc connecting math and science curriculums in the middle school.
Texas Instruments
Texas Instruments: Use the Regression Feature to Find a Line of Best Fit
This tutorial shows you how to enter a set of data and find the line of best fit.
Texas Instruments
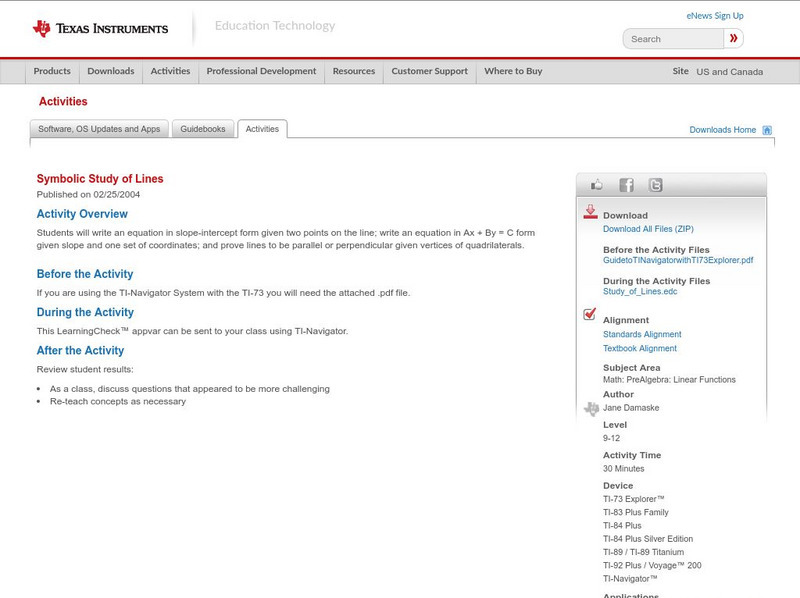
Texas Instruments: Symbolic Study of Lines
Students will write an equation in slope-intercept form given two points on the line; write an equation in Ax + By = C form given slope and one set of coordinates; and prove lines to be parallel or perpendicular given vertices of...
Texas Instruments
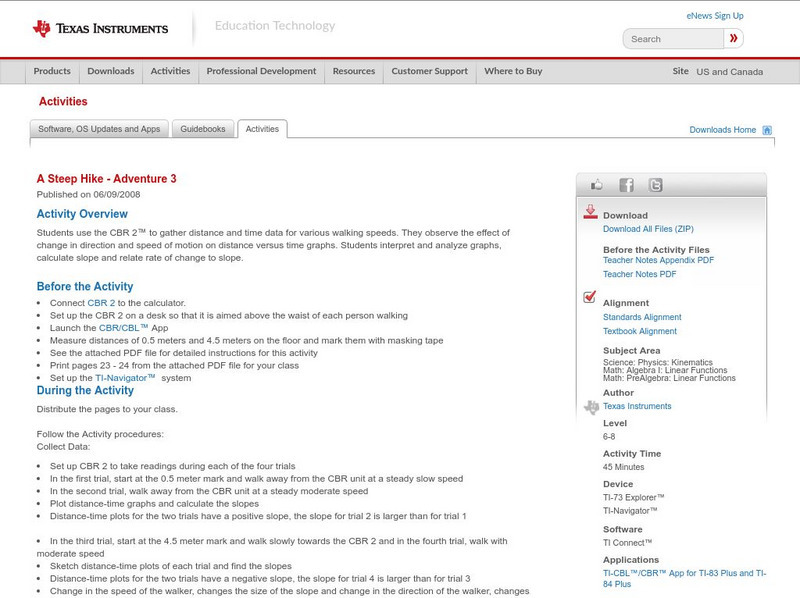
Texas Instruments: A Steep Hike Adventure 3
Students use the CBR 2 to gather distance and time data for various walking speeds. They observe the effect of change in direction and speed of motion on distance versus time graphs. Students interpret and analyze graphs, calculate slope...
Texas Instruments
Texas Instruments: A Wet Welcome Home Adventure 4
Students perform an experiment that simulates a leaking pipe and gather data on volume of water lost over time. They graph the data collected as a scatter plot, find the equation of the line of best fit, find the total volume of water...
Ministry of Education and Universities of the Region of Murcia (Spain)
Ministerio De Educacion Y Ciencia: Funciones Elementales
This is an interactive activity to recognize a liner, quadratic or radical function by its algebraic expression or by its graph.
Shodor Education Foundation
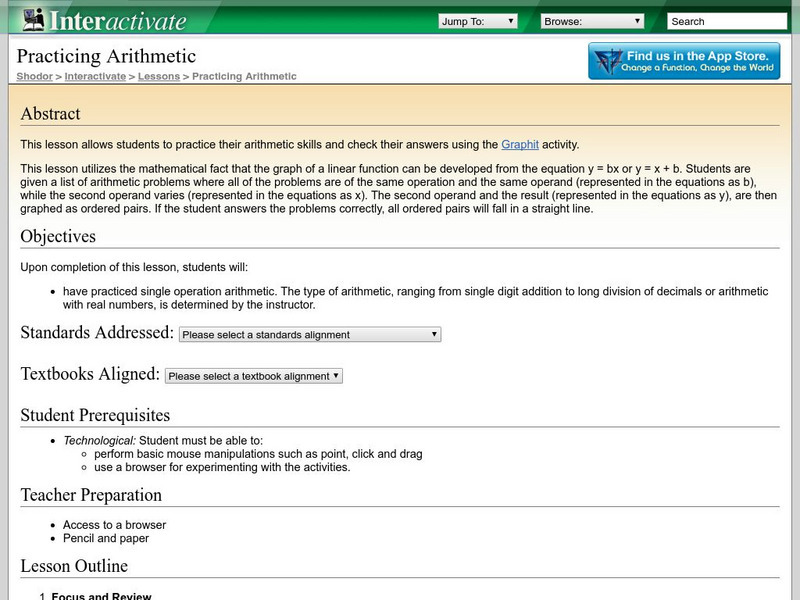
Shodor Interactivate: Lesson: Arithmetic Practice W/ Ordered Pairs
The Shodor Education Foundation provides this lesson plan to have students practice simple computation that results in them graphing their answers. If they are accurate they will have a straight line. Students use an interactive...


