University of South Florida
Fcat: Exploring Linear Equations: Teacher Notes
This lesson plan guides students through the use of a graphing calculator to explore the slope and y-intercept of a line.
Texas Instruments
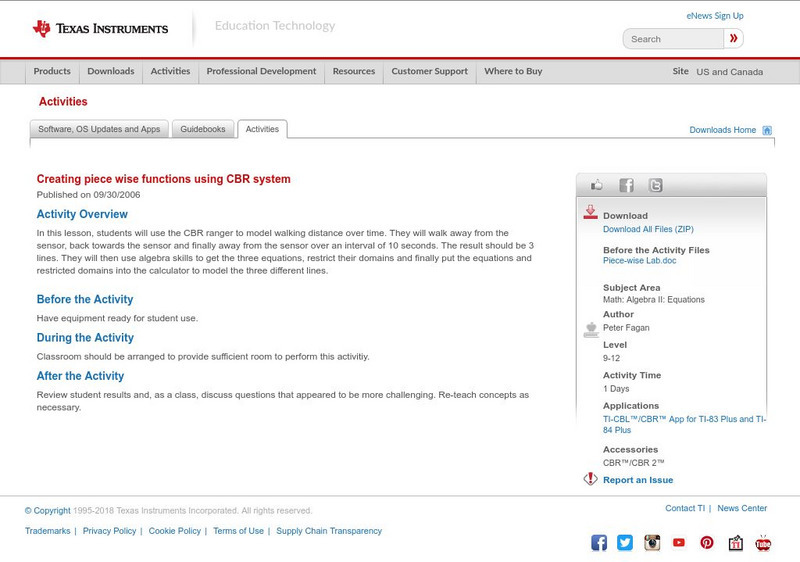
Texas Instruments: Creating Piece Wise Functions Using Cbr System
In this lesson, students can use the CBR ranger to model walking distance over time. They will walk away from the sensor, back towards the sensor and finally away from the sensor over an interval of 10 seconds. The result should be 3...
Other
Desmos: Modeling Bundle
A collection of activities where students investigate mathematical modeling. Activities involve different types of functions, how to examine context and decide on a model, and limitations.
Texas Instruments
Texas Instruments: The Shrinking Dollar
In this activity, students examine the long term effects of inflation. They compute the increase in cost price due to compounding of inflation rates every year. They recognize that this increase in cost price is exponential.
Texas Instruments
Texas Instruments: Getting Started With the Ti Navigator: Picks Theorem
This lesson introduces students to Activity Center and is intended to help students interpret representations of functions of two variables. The Activity Center will be used to investigate equations that represent a company's income,...
Texas Instruments
Texas Instruments: What's My Line?
This activity focuses on strengthening student understanding of connections among graphical, tabular, and algebraic representations of simple linear functions. They enter a simple program that allows them to determine the equations for...
Texas Instruments
Texas Instruments: Social Security Issues
In this activity, you will look at the relationship between the age at which you start drawing social security and the amount drawn. Both graphs and spreadsheets will be used.
Texas Instruments
Texas Instruments: Getting Started With Ti Navigator: Compound Interest
This lesson introduces students' to Activity Center. In this lesson, students will explore the effect of compound interest on the amount of an investment over time. Students will work in small groups (or individually) to calculate...
Texas Instruments
Texas Instruments: Start With Ti Navigator: Braking and Total Stopping Distances
This lesson is intended to introduce students' to Activity Center and is intended to help students develop an understanding of the formulas for braking distance and stopping distance for a variety of vehicles. Students will apply these...
Texas Instruments
Texas Instruments: Match the Graph
In this activity, students walk in front of a calculator-based ranger CBR and try to match a distance-time graph. They examine the rate of change, and analyze and interpret the graph of a function.
Texas Instruments
Texas Instruments: Getting Started With the Ti Navigator: Exponential Models
This lesson introduces students' to Activity Center and represents a suggested TI-Navigator classroom procedure for students to explore an exponential model for the rebound heights of a playground ball.
Texas Instruments
Texas Instruments: Light Years Away
In this activity, students develop models for a light year and compare numbers written in scientific notation and in standard notation.
Texas Instruments
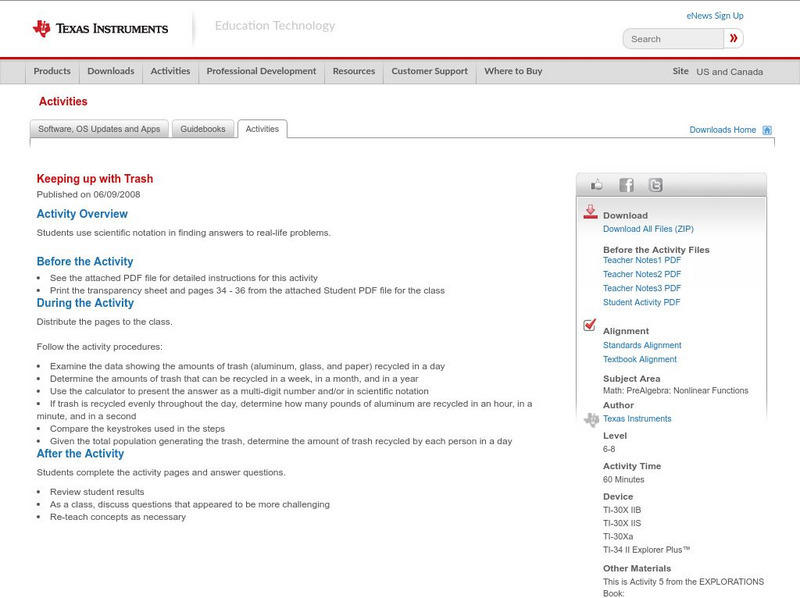
Texas Instruments: Keeping Up With Trash
In this activity, students use scientific notation in finding answers to real-life problems.
Texas Instruments
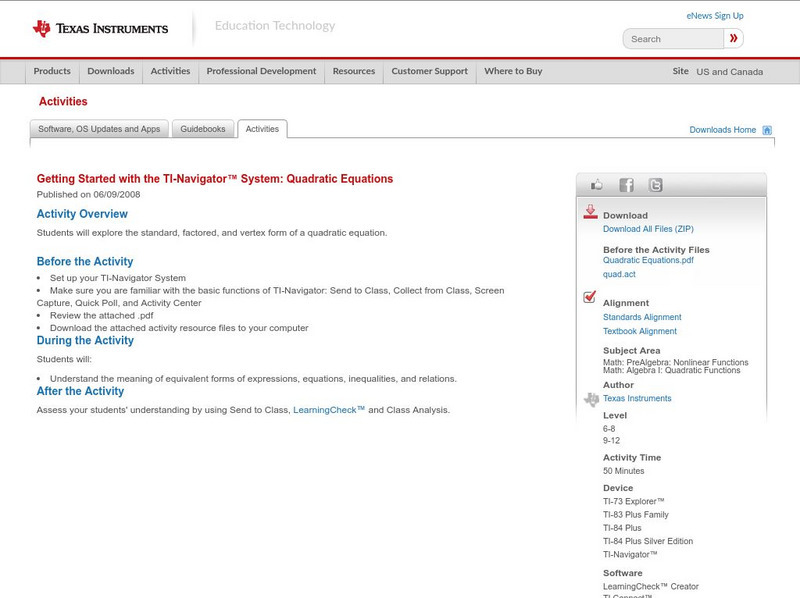
Texas Instruments: Getting Started With the Ti Navigator: Quadratic Equations
This lesson introduces students to Activity Center and is intended to help students write systems of equations in standard form in slope intercept form to solve the system using tables and graphs.
Texas Instruments
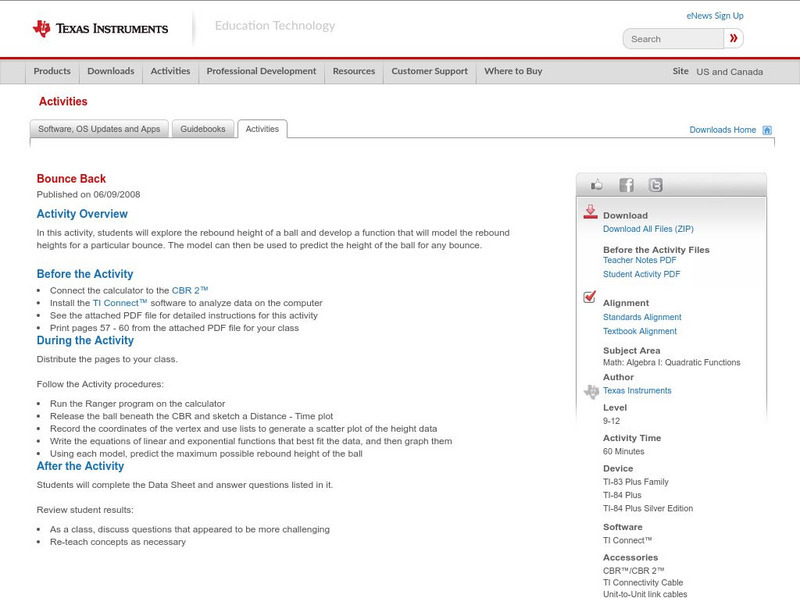
Texas Instruments: Bounce Back
In this activity, students will explore the rebound height of a ball and develop a function that will model the rebound heights for a particular bounce. The model can then be used to predict the height of the ball for any bounce.
Concord Consortium
Concord Consortium: Growing Up
Demonstrate your understanding of linear growth graphs.
Texas Instruments
Texas Instruments: Buried Objects Adventure 1
Students use the CBR 2 to gather data and identify "buried" objects. They interpret and analyze graphs of height as a function of time, and use the change in the y-coordinates of an ordered pair to determine the height of an object.
Texas Instruments
Texas Instruments: Math Today Challenge New Color of Money
In this activity, students will read about the changes in the "new money" and then create a graph to represent various combinations of currency produced. This activity provides an excellent example of discrete, real-world data.
Texas Instruments
Texas Instruments: Walk This Walk
In this activity, students use a motion detector to create Distance versus Time graphs. They experiment with various Distance-Time graphs and write mathematical descriptions of motion with constant velocity.
Texas Instruments
Texas Instruments: What Is Gravity?
In this activity, students will perform a series of experiments with inclined planes. They will learn that as the angle of inclination of the inclined plane approaches 90 degrees, the value of the acceleration of the cart traveling down...
Texas Instruments
Texas Instruments: Getting Started With the Ti Navigator: Population Change
This lesson introduces students to Activity Center and is intended to help students develop the understanding of how use population information to compute populations, changes and to develop population models to make predictions.
Texas Instruments
Texas Instruments: Help, a Pipe Is Leaking!!!
In this activity, students will simulate a pipe leaking and collect data. Students will then use the TI-73 calculator to determine how many gallons would leak at that rate for a 30-day month.
Texas Instruments
Texas Instruments: Guess My Coefficients App
Students play a game to identify the correct equation for the graph displayed. Through the game setting, they review graphs and equations of linear, quadratics, and absolute value functions.
Texas Instruments
Texas Instruments: Tic, Toc: Pendulum Motion
In this activity, students' will use a motion detector to plot the position versus time graph for a swinging pendulum. They will determine the period of the motion and model the position data using a cosine function.


