Curated OER
Linear Functions and Piecewise Linear Functions
An activity that could function as a review or as a quiz, this learning exercise prompts students to find two different linear functions that satisfy the given equation. Students sketch the graph of two linear equations. They identify...
Curated OER
How Dense is Salt Water?
Young schoolers explore the concept of linear regression. They determine the mass and density of salt water. Pupils add salt to water and record the density as salinity increases, and perform a linear regression on the data to model the...
Curated OER
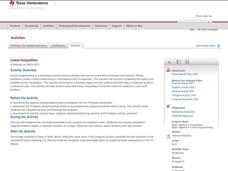
Linear Inequalities
Through exploration of linear programming through graphs and equations of inequalities, students relate linear programming to real life scenarios, such as business. Graphing and shading is also part of this exercise.
West Contra Costa Unified School District
Evaluating Functions
Functions as inputs for other functions? After reviewing function notation and how to input values to evaluate functions, class members input functions into functions, essentially determining the composition of functions.
Mathematics Vision Project
Module 3: Features of Functions
Learn how to represent functions in multiple ways. Learners analyze functions as equations, graphs, and verbal descriptions. The analysis includes intercepts, behavior, domain, and range. The module of seven lessons makes up the third...
West Contra Costa Unified School District
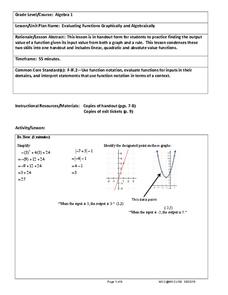
Evaluating Functions Graphically and Algebraically
High schoolers evaluate functions graphically and algebraically. After completing that step, they write a statement describing the input and output.
Curated OER
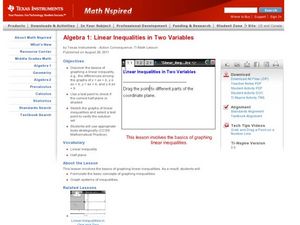
Linear Inequalities in Two Variables
Graph and solve linear equations in two variables. The class relates the concepts of linear equations to the real world.
Curated OER
Application of Linear Systems
Let the learners take the driving wheel! The class solves systems of linear equations and applies the concepts of systems to solve a real-world situation about parking cars and buses. They then use calculators to create a visual of their...
Radford University
Regression Analysis Activity
Don't let your knowledge of regression analysis regress. Pupils take part in three activities to learn about regression curves. They research and collect data to predict how long it will take a basketball to hit the ground, find a...
Mathalicious
Domino Effect
Carryout the lesson to determine the cost of pizza toppings from a Domino's Pizza® website while creating a linear model. Learners look through real data—and even create their own pizza—to determine the cost of each topping. They explore...
Mt. San Antonio Collage
Test 1: Functions and Their Graphs
Save the time creating an assessment because these function problems should do the trick. With 10 multi-part questions, they each focus on a different topic including radical, polynomial, linear and piecewise functions. The majority of...
Curated OER
Using Tables to Solve Linear Functions
Oh that intercept! Budding algebra masters solve linear equations from standard to intercept form. They identify the slope and y-intercept to help graph the lines, an then create coordinate pairs using a table of values. Great TI tips...
Curated OER
Interactivate: Introduction to Functions
This interactive website provides a variety of lesson plans according to which standards you are applying and which textbook you use. Introduce functions to your class by having them construct single operation machines and create...
Mathematics Common Core Toolbox
Golf Balls in Water
Here's a resource that models rising water levels with a linear function. The task contains three parts about the level of water in a cylinder in relationship to the number of golf balls placed in it. Class members analyze the data and...
Illustrative Mathematics
Velocity vs. Distance
At the end of this activity, your number crunchers will have a better understanding as to how to describe graphs of velocity versus time and distance versus time. It is easy for learners to misinterpret graphs of velocity, so have them...
Curated OER
Explore Learning Exponential Functions
High schoolers graph exponential equations and solve application problems using exponential functions. They re-enact a story about a peasant worker whose payment for services is rice grains doubled on a checker board. They place M &...
Curated OER
Exponential Functions
Learners graph exponential equations of the form y=Ma. They understand the effects of M, a, and k on the graph. They solve application problems using exponential functions.
Curated OER
Reflections of a Linear Function
Learners reflect functions about the X-axis, Y-axis, and origin. They derive equations for reflected functions using the website www.explorelearning.com.
Curated OER
Functions and the Vertical Line Test
Students examine functions and function notation. They use computer activities to discover how to graph functions, and conduct a vertical line test. Students describe spatial relationships using coordinate geometry.
Curated OER
Linear and Exponential Models
Students investigate the differences between linear and exponential models. In this linear and exponential models lesson, students make a table of given data. Students determine if the data is linear or exponential by plotting the data...
Curated OER
Products of Linear Functions
Students investigate the horizontal intercepts of functions. In this algebra lesson, students identify whether the factor of two functions results in a quadratic equation or not. They compare and contrast linear equations and higher...
Curated OER
Iterating Linear Functions
Students use a spreadsheet to investigate data. For this algebra lesson, students collect and graph data on a coordinate plane. They explain properties of a linear equation both algebraically and orally.
Curated OER
Graphing and Interpreting Linear Equations in Two Variables
Graph linear equations using a table of values. Learners solve equations in two variables using standard form of an equation. They identify the relationship between x and y values.
Curated OER
Linear Programming
Learners explore inequalities to determine the optimal solution to maximize a profit for a company. In this linear programming lesson, students discover how to graph inequalities and how to determine the algebraic representation of a...


