Texas Instruments
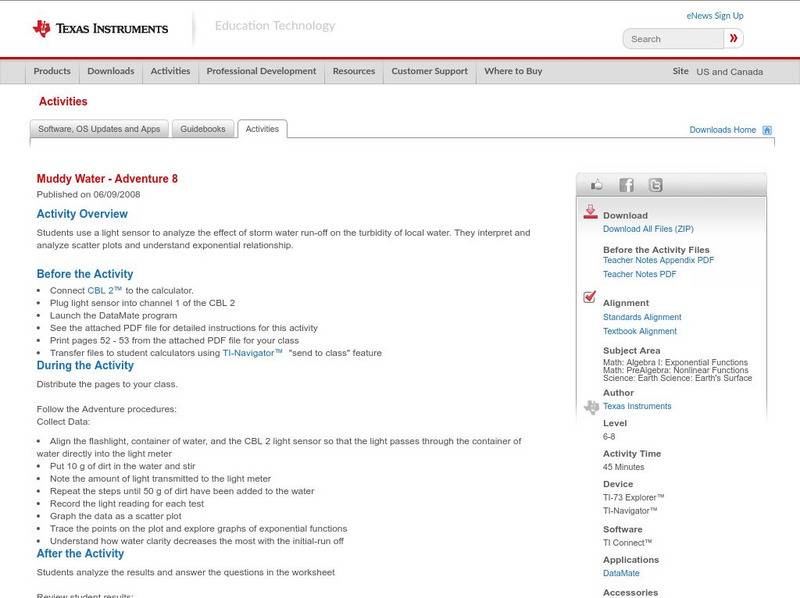
Texas Instruments: Muddy Water Adventure 8
Students use a light sensor to analyze the effect of storm water run-off on the turbidity of local water. They interpret and analyze scatter plots and understand exponential relationship.
Texas Instruments
Texas Instruments: Getting Started With the Ti Navigator: Discount Savings
This lesson is intended to help students develop an understanding of sale information to compute discounts, discount rates, original prices and sale prices.
Texas Instruments
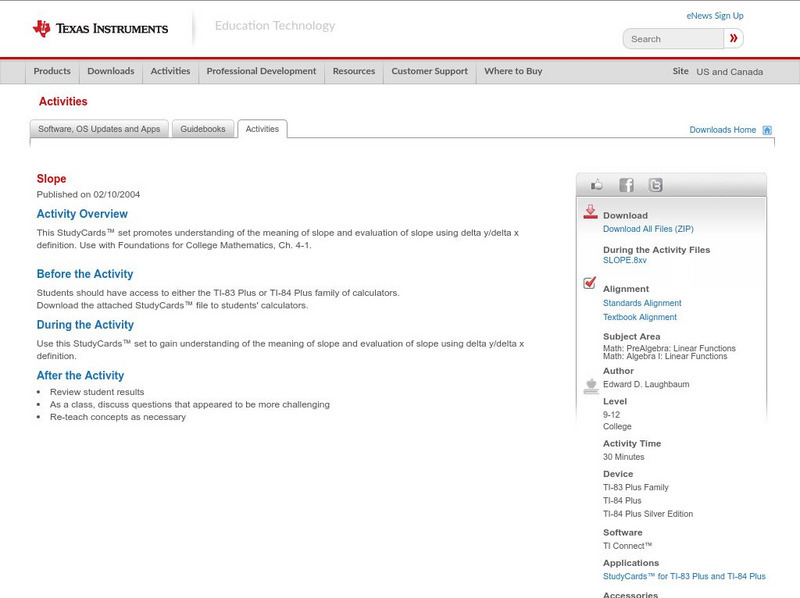
Texas Instruments: Slope
This StudyCards set promotes understanding of the meaning of slope and evaluation of slope using y/x definition.
Texas Instruments
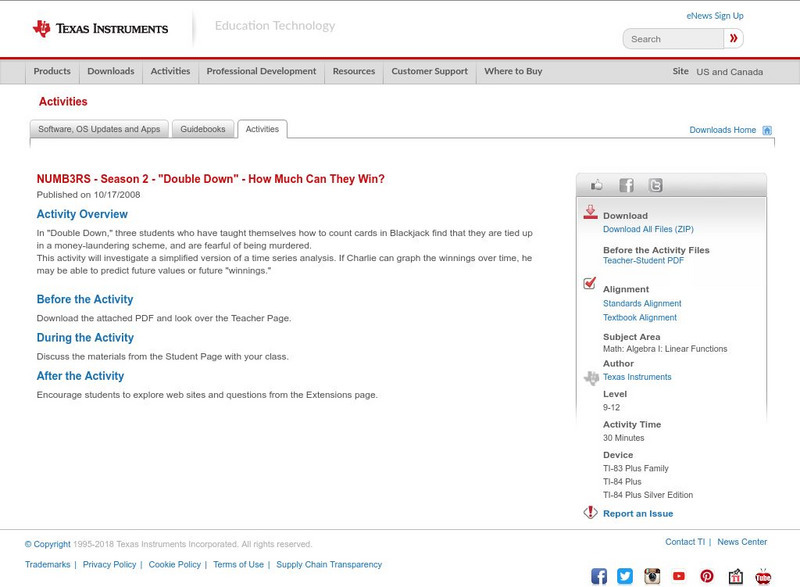
Texas Instruments: Numb3 Rs: How Much Can They Win?
Based off of the hit television show NUMB3RS, this lesson has students create data points from given information, plot those points, and then create a line of best fit. This is done in the context of playing blackjack, although the...
PBS
Pbs: Black Kingdoms of the Nile
A geometry lesson that examines the history and structure of ancient pyramids and engages students in constructing pyramid models. A comprehensive lesson that considers students with diverse learning styles. Math concepts introduced...
Texas Instruments
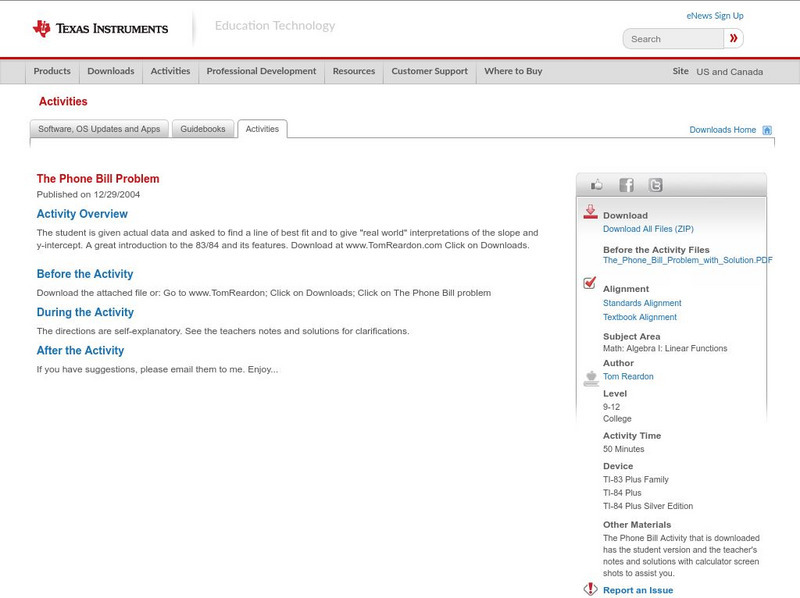
Texas Instruments: The Phone Bill Problem
The student is given actual data and asked to find a line of best fit and to give "real world" interpretations of the slope and y-intercept. A great introduction to the 83/84 and its features.
Texas Instruments
Texas Instruments: Connecting Factors and Zeros
Students will determine if a quadratic formula is factorable, then they will factor the equation, set each factor equal to 0, and solve for x.
Other
Stat Soft: Statistics Glossary
Dozens of statistical terms are defined and illustrated in this glossary.
Disfruta Las Matematicas
Disfruta Las Matematicas: Introduccion Al Algebra
This unit could be used as supplementary material for Algebra. It has good examples with illustrations and some interactive activities.
Science Education Resource Center at Carleton College
Serc: Population Growth, Ecological Footprints, and Overshoot
In this three-part activity, students apply linear, exponential, and rational functions to explore past and projected U.S. population growth, carbon footprint trend, ecological overshoot, and effectiveness of hypothetical carbon dioxide...
Texas Instruments
Texas Instruments: Fitting an Equation to Bivariate Data
In this activity, students fit a linear least-square regression line to population data. They explore various functions to model the given data.


