Ohio Literacy Resource Center
Solving Systems of Linear Equations Graphing
Do you need to graph lines to see the point? A thorough lesson plan provides comprehensive instruction focused on solving systems of equations by graphing. Resources include guided practice worksheet, skill practice worksheet, and an...
Mathematics Assessment Project
Matching Situations, Graphs and Linear Equations
What do guitars, candles, and helicopters have in common? They're all in this resource. Learners complete an assessment task to determine the amount of profit made in a guitar class based on given information regarding variable...
Teach Engineering
Edible Rovers (High School)
Design and build a rover ... then eat it? This activity has groups of two design and build Mars rovers. The teams determine what instruments they want to include with their rover and plan a budget. They calculate the cost of the body of...
EngageNY
Lines That Pass Through Regions
Good things happen when algebra and geometry get together! Continue the exploration of coordinate geometry in the third lesson in the series. Pupils explore linear equations and describe the points of intersection with a given polygon as...
101 Questions
Blocks
Block play can teach children about gravity, physics, and spatial relationships. A hands-on lesson incorporates these concepts with an activity in which learners examine the relationship between levels in a pile. Scholars begin to...
Mathalicious
Out of Left Field
A baseball trajectory and a parabola seem to make the best pair in real-world quadratic applications. Here is a current baseball resource with questions, discussions, and explorations regarding a quadratic function and home run...
Curated OER
Comparing Linear and Exponential Functions
Teach your class how to differentiate between linear and exponential functions. They use exponential properties to solve problems, graph them using the TI-Navigator, and make comparisons.
Curated OER
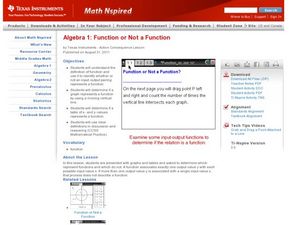
Function or Not a Function
Graphing linear equations on the TI is easy! Through examination of graphs and identification if it is a function or not, this lesson can relate to the real world.
Howard County Schools
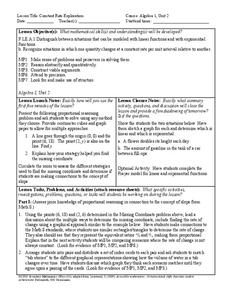
Constant Rate Exploration
Question: What do rectangles and bathtub volume have in common? Answer: Linear equations. Learn how to identify situations that have constant rates by examining two different situations, one proportional and one not proportional.
Curated OER
Barbie Bungee
Middle and high schoolers collect and analyze their data. In this statistics lesson, pupils analyze graphs for linear regression as they discuss the relationship of the function to the number of rubber bands and the distance of the...
Curated OER
Systems of Equations and Inequalities
This is a comprehensive lesson on creating and solving equations and systems of equations and inequalities. Problems range from basic linear equations to more complex systems of equations and inequalities based on a real-world examples....
Curated OER
Roman Bernardo: Solving Linear Equations
Mathematicians use an inquiry method to solve linear equations. In this linear equations instructional activity, students practice solving equations using addition, subtraction, multiplication and division. They solve multi-step...
PBL Pathways
Medical Insurance 3
Create a technical report explaining the components of a medical plan through a function. The project-based learning activity gives a medical insurance scenario that young mathematicians model using piecewise functions. Their analyses...
Stats Monkey
Everything I Ever Needed to Learn about AP Statistics I Learned from a Bag of M and M's®
Candy is always a good motivator! Use this collection of M&M's® experiments to introduce statistics topics, including mean, standard deviation, nonlinear transformation, and many more. The use of a hands-on model with these AP...
Curated OER
Comparing Linear and Exponential Data
Students graph linear and exponential equations. In this algebra lesson, students differentiate between linear and exponential equations. They relate it to the real world.
Curated OER
Local Linearity
In order to investigate local linearity, young scholars graph the function on the TI-calculator and zoom to observe the change in slope on the line. They incorporate technology to visualize these problems.
Texas Instruments
TI-Nspire™ CAS
When it comes to rating educational calculators, this calculator is always near the top of this list. Now it's available as an app. There is a lot of calculator power wrapped up in this app. Not only is this a fully functioning...
Texas Instruments
TI-Nspire™
We landed on the moon with less computing capabilities than you can find in this app! Here is a multiple function calculator that takes all the power you get from a handheld and adds the wonderful large screen that only a tablet can...
EngageNY
Arithmetic and Geometric Sequences
Arithmetic and geometric sequences are linear and geometric patterns. Help pupils understand the relationship and see the connection with an activity that asks them to write the rules and classify the patterns correctly. A sorting...
Curated OER
Families of Functions
Students investigate families of functions. In this families of functions lesson, students discuss how changing a functions parameters affect its' graph. Students vary slope and y-intercepts of linear functions. Students stretch and...
Curated OER
Count the Differences
Pupils find the difference between consecutive y-values on the calculator and write an equation that fits the data. They continue finding the differences in consecutive y-values using lists on their calculator. Learners conclude as they...
West Contra Costa Unified School District
Point-Slope Application Problems
Create a linear equation for a problem when the intercept information is not given. The two-day lesson introduces the class to the point-slope form, which can be used for problems when the initial conditions are not provided. Pupils...
5280 Math
More or Less the Same
Tell the story of the math. Given a graph of a linear system, learners write a story that models the graph before crafting the corresponding functions. Graphs intersect at an estimated point, allowing for different variations in the...
EngageNY
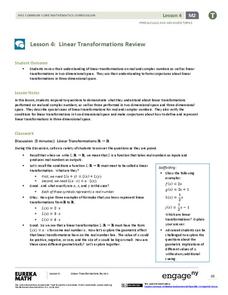
Linear Transformations Review
Time for matrices and complex numbers to come together. Individuals use matrices to add and multiply complex numbers by a scalar. The instructional activity makes a strong connection between the operations and graphical transformations.


