Curated OER
Crossing the Asymptote
Students investigate graphs and their asymptotes. In this precalculus activity, students examine the numerator and denominator of their rational functions. This helps them identify where and when the graph will cross its asymptote.
Curated OER
Euler's Method
Learners identify Euler's method of graphing in this calculus lesson. They approximate values of a function and check their work using EM. They also differentiate equations at an exact point.
Curated OER
Quadratics: Polynomial Form
Students determine how changes in the coefficients in a quadratic function affect its graph. They determine how to use the equation to determine the intercepts of a quadratic function. Students identify the location of the intercepts...
Curated OER
Investing
Pupils collect data on investments and draw conclusions. In this algebra lesson, students analyze exponential graphs as they relate to money. They discuss the cause of an account balance being high or low.
Curated OER
Saving the Bald Eagle
Students plot on a coordinate plane. In this algebra lesson, students identify points on a coordinate plane and graph lines given coordinate pairs. They create a model as they study bald eagles and their growth and decay.
Curated OER
Using a Multi- Sensory Approach
Students identify the slope of a line given two points on the line. In this algebra lesson, students solve linear equations by finding and comparing slopes of lines. They differentiate between the steepness of the slope and the line.
Curated OER
Normal Probability Plot
Young scholars analyze the graph of a distribution. For this statistics lesson, students define skewed or mound shape distribution as they investigate the data behind the graph. They define and plot outlier as well as normal probability.
Curated OER
Using Systems of Equations
In this algebra instructional activity, students solve systems of equations. They use substitution, elimination and graphing to solve. There are 33 questions with an answer key.
Curated OER
Stressed to the Breaking Point
High schoolers explore the relationship between the amount of weight that can be supported by a spaghetti bridge, the thickness of the bridge, and the length of the bridge to determine the algebraic equation that best represents that...
Curated OER
Identifying slope from Equations
Pupils find the slope of a line given a linear equation in slope-intercept form. They also find the slope of a line given a linear equation in standard form. Students finally graph the line to show it visually.
Curated OER
Introduction to Solving Quadratic Equations by Factoring
Students solve quadratic equations. In this algebra lesson, students factor and graph linear and quadratic functions. They identify the standard and linear form of each equation.
Curated OER
Moving Straight Ahead
Students analyze the relationship between speed, time and distance. In this math lesson, students plan a school trip. Students determine the efficiency and cost effectiveness of a trip.
Curated OER
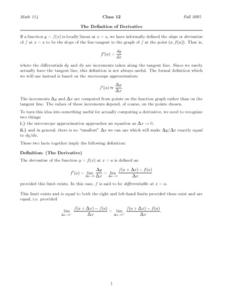
The Definition Derivative
In this derivative worksheet, students evaluate limits, factor equations, and calculate the given function. They determine the derivative of a function and plot it on a graph. This four-page worksheet contains eight problems.
Curated OER
Particle Motion1
Students analyze piecewise functions. In this precalculus lesson, students identify the position, velocity and distance. They analyze the relationship between the graph, its position and velocity.
Curated OER
Introduction to Parametric Equations
Students write and solve parametric equations. In this algebra lesson, students find and eliminate parameter of equations. They graph parametric equations and analyze the graphs.
Curated OER
Logarithmic Transformations of Data
Students investigate and study logarithmic equations. In this precalculus instructional activity, students analyze the data behind the function. They define each graph as positive, negative or no correlation. They find the line of best fit.
Curated OER
Will Exams Be Cancelled?
If the flu outbreak continues, exams will have to be canceled. Investigate the properties of exponential and logarithmic functions. In this algebra lesson, students use the TI to examine and differentiate between exponential growth and...
Curated OER
Collecting And Fitting Quadratic Data
High schoolers investigate the concept of using quadratic data to plot coordinates on a plane. They also apply the quadratic formula for a variety of problems with the help of a graphing calculator to draw the parabola for given...
Curated OER
The Quadratic Formula
Students solve quadratic function by completing the square. In this algebra lesson, students use the quadratic formula to factor quadratics and find the roots. They graph the parabola and identify its properties.
Curated OER
Whose Line is it Anyway?
Students solve systems of equations. In this algebra lesson, students identify the domain and range of each function. They use the slope and y-intercept to graph each line.
Curated OER
Cartesian Coordinate System
Young scholars explore the Cartesian coordinate plane and plot points on the graph. They interpret coordinates for a point from the graph and give the ratio of rise over run for slope.
Curated OER
Discovering Pi
Students develop a formula that describes the functional relationship of the circumference of a circle to its diameter. Working with a partner, they measure the diameter and circumference of circular objects in order to discover the...
Curated OER
The Slope of a Curve
Students graph the slopes of a line using the intercepts. In this precalculus lesson, students identify the properties of a curve slope. They find the limit and use a graping calculator to graph their lines.
Curated OER
Worksheet 11
In this math worksheet, students find a solution basis and compute the Wronskian for each of the equations. Then they sketch a graph of a typical solution.


