Virginia Department of Education
Quadratic Curve of Best Fit
Class members create a table of the number of chords that can be drawn given the number of points on a circle. Pupils analyze the data created, find a function to fit to it, and use the function to make further predictions.
Achieve
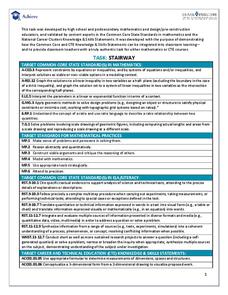
Stairway
It's the stairway to learning! Scholars research all aspects of building a staircase. Using information from building codes, they write and graph a system of inequalities to analyze the constraints. The completed project is a scale model...
Curated OER
Compound Inequalities and Graphing
Put geometry skills to the test! Learners solve compound inequalities and then graph the inequalities on a coordinate plane using their geometric skills. They identify the slope and y-intercept in order to graph correctly. I like this...
Mathematics Assessment Project
Classifying Equations of Parallel and Perpendicular Lines
Parallel parking might be difficult, but finding parallel lines is fairly simple. In this lesson, learners first complete an assessment task involving parallel and perpendicular lines in the coordinate plane. Individuals then take part...
Curated OER
Modeling a Planetary Nebula
In this modeling a planetary nebula worksheet, students use a diagram to calculate the intensity at different radii from the center of the nebula. Students use the Pythagorean Theorem to determine the distance between two points on the...
Curated OER
FCAT Real World Solving Linear Equations/Systems
Pupils relate real life situation to the equations, graphs and inequalities. They model real life scenarios using matrices and draw conclusions from their data. This lesson plan is aligned with FCAT.
Curated OER
Count the Differences
Learners determine the degree of polynomials. In this determining the degree of polynomials lesson, students find the difference between consecutive y-values. Learners find the degree of a linear, quadratic, and cubic function by this...
Curated OER
More Problems in Context: Linear Models
Six application problems help learners to master their knowledge of linear models. Each problem is cited with the original publication source. These questions could be a good class activity, homework assignment, or incorporated into a quiz.
Curated OER
Classifying Functions
Eleventh graders sort different types of functions including rational, periodic, exponential, polynomial, quadratic, logarithmic and linear using "function cards." The functions are displayed in multiple representations including...
Inside Mathematics
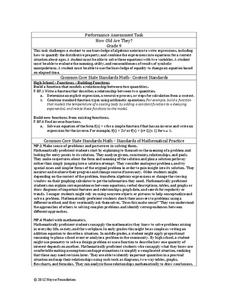
How Old Are They?
Here is a (great) lesson on using parentheses! The task requires the expression of ages using algebraic expressions, including the distributive property. Pupils use their expressions to determine the individual ages.
Inside Mathematics
Conference Tables
Pupils analyze a pattern of conference tables to determine the number of tables needed and the number of people that can be seated for a given size. Individuals develop general formulas for the two growing number patterns and use them to...
Virginia Department of Education
Line of Best Fit
Pupils work through a guided activity on fitting a linear equation to a set of data by entering the data into a calculator and trying to envision a line of best fit. They then have the calculator determine the least-squares line and...
Natinal Math + Science Initative
Slope Investigation
Context is the key to understanding slope. A real-world application of slope uses a weight loss scenario with a constant rate of change to introduce the concept of slope of a line, before it makes a connection to the ordered pairs and...
Balanced Assessment
Transformation II
Develop a solid understanding of the manipulation of expressions to produce equivalent expressions. Given an expression, pupils rearrange it to create a new one. Their new functions must match the structure of the model expressions.
Ms. Amber Nakamura's Mathematics Website
Algebra Project
What would your dream house look like? A cottage? A medieval castle? High schoolers enrolled in Algebra design the perfect house while using slopes to write equations for various aspects of the project.
Curated OER
What's My Pattern?
Students recognize, describe and extend patterns in three activities. They organize data, find patterns and describe the rule for the pattern as well as use the graphing calculator to graph the data to make and test predictions. In the...
Curated OER
Algebra II: Chapter 7 Test - Systems of Equations
In this systems of equations worksheet, students solve systems of equations, systems of inequalities, and linear equations. They read word problems and write a system of equations that depicts the problem. this two-page worksheet...
Illustrative Mathematics
High School Graduation
An exercise in finding the approximate time that a name would be called at a graduation. Estimating time may be difficult for some of the class, so this resource would not be a good choice for learning this standard. It does end with a...
Illustrative Mathematics
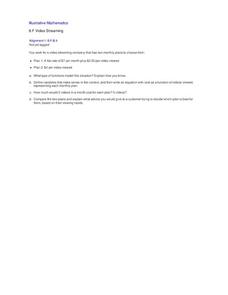
Video Streaming
Your movie fans will be interested in this resource. They will compare video streaming plans. One plan charges a set rate per month and a reduced viewing fee, and the other has a flat rate per each video viewed. Unfortunately, students...
Virginia Department of Education
Spring Fling Carnival
Think critically — and linearly by applying linear equations to solve real-world problems. Young mathematicians write equations to model the profit on popcorn and cotton candy at a carnival and solve problems using these equations.
American Statistical Association
What Fits?
The bounce of a golf ball changes the result in golf, mini golf—and a great math activity. Scholars graph the height of golf ball bounces before finding a line of best fit. They analyze their own data and the results of others to better...
EngageNY
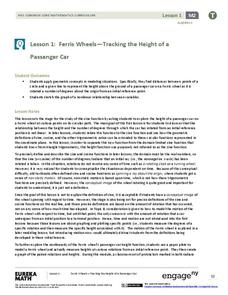
Ferris Wheels—Tracking the Height of a Passenger Car
Watch your pupils go round and round as they explore periodic behavior. Learners graph the height of a Ferris wheel over time. They repeat the process with Ferris wheels of different diameters.
Howard County Schools
Planning for Prom
Make the most of your prom—with math! Pupils write and use a quadratic model to determine the optimal price of prom tickets. After determining the costs associated with the event, learners use a graph to analyze the break even point(s).
101 Questions
Coins in a Circle
Round and round you'll go! Learners watch as different-sized circles fill with coins. They collect data and then make a prediction about the number of coins that will fit in a large circular rug.


