Curated OER
Can You Carry a Tune in a Bucket?
Students use water filled pipes to play a tune and consider the mathematics behind the sound waves. In this sound wave lesson, students play a tune with water filled pipes. They create a mathematical model to evaluate the wavelengths and...
Curated OER
Exploding Numbers
Students discuss how numbers increase when exponential growth is occurring. They view a video and compare exponential and linear growth with a graphing calculator.
Mathematics Vision Project
Module 1: Getting Ready Module
This fabulous resource is a must-have for any algebra teacher's arsenal of lessons. Developing the idea of equations and use of variables from basic physical scenarios, learners gain valuable intuition in the structure and meaning of...
Shodor Education Foundation
Sequencer
Take the first step into graphing sequences. Learners set the starting number, multiplier, add-on, and the number of steps for a sequence. Using the inputs, the interactive calculates and plots the sequence on the coordinate plane. Users...
Shodor Education Foundation
Recursion
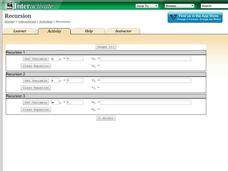
Perform the operation ... and then do it again. Scholars investigate recursive formulas by creating and graphing them. Using the interactive, pupils set the variable, determine the initial value, and type in a recursive formula.The...
Curated OER
Aboriginal Hand Prints
A part of a study of Australian Aboriginal culture, class members listen to a Dreamtime story about a father who stenciled his handprint on a rock wall. Class members then make their own hand print art representative of themselves...
Curated OER
Reading Graphs
Students practice plotting functions on the Cartesian coordinate plane, see several categories of functions, including lines and parabolas, and read a graph, answering questions about the situation described by the graph
Curated OER
Logarithmic Transformations of Data
Students investigate and study logarithmic equations. In this precalculus instructional activity, students analyze the data behind the function. They define each graph as positive, negative or no correlation. They find the line of best fit.
Curated OER
Reading Graphs
Students plot functions on the Cartesian coordinate plane. They explore lines and parabolas. Students analyze graphs and answer questions about the information presented on the graph using an online program.
Curated OER
Saving the Bald Eagle
Students plot on a coordinate plane. In this algebra lesson, students identify points on a coordinate plane and graph lines given coordinate pairs. They create a model as they study bald eagles and their growth and decay.
Curated OER
Position and Piecewise Velocity
Students solve piecewise functions. In this precalculus lesson plan, students model real life scenarios using velocity and piecewise. They create velocity graphs and find the beginning and end position of an object.
Curated OER
The Mandelbrot Set
Students are introduced to the notion of a complex number and function iteration in order to motivate the discussion of Julia sets and the Mandelbrot set.
Curated OER
Quadratics: Polynomial Form
Students determine how to use the polynomial form of a quadratic equation to find the location of the vertex on a graph. They determine how changes in the coefficients in a quadratic function affect its vertex on a graph. Students find...
Curated OER
Race The Rapper: Slopes
Students calculate the slope of the equation For this algebra lesson, students graph coordinate pairs of linear equations and identify the relationship between x and y values and slope. They differentiate between functions and...
Curated OER
Quadratics: Polynomial Form
Students determine how changes in the coefficients in a quadratic function affect its graph. They determine how to use the equation to determine the intercepts of a quadratic function. Students identify the location of the intercepts...
Curated OER
Whose Line is it Anyway?
Students solve systems of equations. In this algebra lesson, students identify the domain and range of each function. They use the slope and y-intercept to graph each line.
Curated OER
Quadratics: Polynomial Form
High schoolers determine how changes in the coefficients in a quadratic function affect its graph. They Solve a quadratic equations. Students Determine how to use the equation to determine the intercepts of a quadratic function. They...
Curated OER
Plotting Temperature and Altitude
students convert the temperature readings from degrees Celsius to degrees Fahrenheit. they predict and create a graph of what the graph of altitude (x-axis) versus temperature in degrees Fahrenheit (y-axis) might look like.
Curated OER
Battery Depletion and Piecewise Linear Graphing
Pupils examine a recent flight of Pathfinder. In groups, they use the information to create a table of values showing the battery charge of the space machine. They predict what the charge would be further on in the mission. They use the...
Curated OER
Moving Straight Ahead
Students analyze the relationship between speed, time and distance. In this math lesson, students plan a school trip. Students determine the efficiency and cost effectiveness of a trip.
Curated OER
Introduction to Solving Quadratic Equations by Factoring
Students solve quadratic equations. In this algebra lesson, students factor and graph linear and quadratic functions. They identify the standard and linear form of each equation.
Curated OER
Will Exams Be Cancelled?
If the flu outbreak continues, exams will have to be canceled. Investigate the properties of exponential and logarithmic functions. In this algebra lesson, students use the TI to examine and differentiate between exponential growth and...
Curated OER
Exploring Arrangements of 2, 3, 4, and 5 Cubes
Young scholars use problem solving skills to create various models of tricubes, tetracubes, and pentacubes. They classify the cubes into various groupings and identify them as mirror images, regular arrangements, and irregular...
Curated OER
Conjectures and Conclusions
Students draw conclusions and make conjectures given a specific scenario. In this geometry lesson, students model real life scenarios using properties of triangles. They model number facts and explain why the outcome is what it is.


