Curated OER
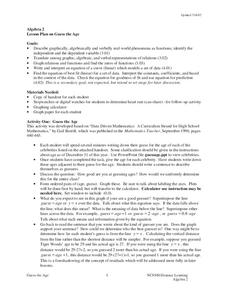
Guess the Age
Learners explore functions using real world application. In this algebra lesson, students play a game as they apply concepts of function. They graph their findings and discuss it with the class.
Curated OER
How Atoms Work
Students analyze the way atoms function and how they combine to form molecules and various compounds. Using a software program, they create a diagram of an atom and write a summary about their functions. They complete a worksheet and...
Curated OER
Skeeter Populations and Exponential Growth
Students perform investigations on the growth of populations and use exponential functions to represent that growth. They watch a video clip of growth patterns. Students work in groups to determine the "population" of each color of...
Curated OER
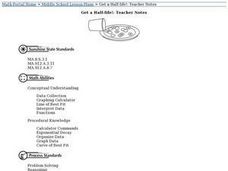
Get a Half Life!
Eighth graders use M&M's to experiment with data. They use a graphing calculator to determine the best equation for their data; linear, quadratic or exponential. They analyze the data to find the half-life of their M&M's.
Curated OER
Hybrid Vehicles: Cut Pollution and Save Money
Students examine how driving a hybrid car can save money and cut down on pollution. In this hybrid vehicles lesson students complete an exercise that shows them how to work with proportions, percents, dimensional analysis and linear...
Curated OER
Solving One Step Equations Using Algebra Tiles
Students solve linear equations. In this algebra lesson, students solve equations using addition, subtraction, division and multiplication. They evaluate and simplify functions.
Curated OER
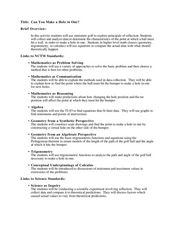
Can You Make a Hole in One?
Students relate miniature golf to reflection of an image. In this algebra lesson, students collect and graph data as they study linear equations. They apply properties of graphing to solve real life scenarios.
Curated OER
The Mandelbrot Set
Students explore the Mandelbrot Set. They are introduced to the concept of a complex number and function in order to motivate the discussion of Julia and Mandelbrot sets. Students investigate fractals and how they are built.
Curated OER
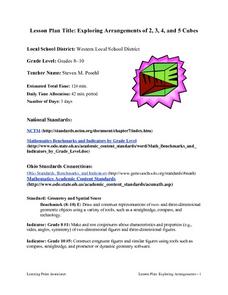
Exploring Arrangements of 2, 3, 4, and 5 Cubes
Students construct models of various tricubes, tetracubes, and pentacubes that are possible, classify n-cubes into different groupings, and draw these figures on isometric dot paper giving true perspective to what they visualize.
Curated OER
Balancing Acts
Fourth graders solve problems that can be modeled with algebraic equations or expressions. There are five sets of problems. Students should attempt one problem from each set each day. They increase in difficulty as the week progresses....
EngageNY
Polynomial, Rational, and Radical Relationships
This assessment pair goes way beyond simple graphing, factoring and solving polynomial equations, really forcing learners to investigate the math ideas behind the calculations. Short and to-the-point questions build on one another,...
Inside Mathematics
Vencent's Graphs
I like algebra, but graphing is where I draw the line! Worksheet includes three multiple-part questions on interpreting and drawing line graphs. It focuses on the abstract where neither axis has numbers written in, though both are...
Curated OER
Describing Data
Your learners will practice many ways of describing data using coordinate algebra in this unit written to address many Common Core State Standards. Simple examples of different ways to organize data are shared and then practice problems...
Radford University
A Change in the Weather
Explore the power of mathematics through this two-week statistics unit. Pupils learn about several climate-related issues and complete surveys that communicate their perceptions. They graph both univariate and bivariate data and use...
Inside Mathematics
Snakes
Get a line on the snakes. The assessment task requires the class to determine the species of unknown snakes based upon collected data. Individuals analyze two scatter plots and determine the most likely species for five additional data...
Inside Mathematics
Coffee
There are many ways to correlate coffee to life, but in this case a worksheet looks at the price of two different sizes of coffee. It requires interpreting a graph with two unknown variables, in this case the price, and solving for those...
American Statistical Association
Scatter It! (Predict Billy’s Height)
How do doctors predict a child's future height? Scholars use one case study to determine the height of a child two years into the future. They graph the given data, determine the line of best fit, and use that to estimate the height in...
West Contra Costa Unified School District
Correlation and Line of Best Fit
Computers are useful for more than just surfing the Internet. Pupils first investigate scatter plots and estimate correlation coefficients. Next, they use Microsoft Excel to create scatter plots and determine correlation coefficients and...
American Statistical Association
You and Michael
Investigate the relationship between height and arm span. Young statisticians measure the heights and arm spans of each class member and create a scatter plot using the data. They draw a line of best fit and use its slope to explain the...
Explore Learning
Quadratics: Polynomial Form
Throught this subscription-based sight, learners explore different aspects of the parabola by changing equations from standard to vertex form. Next, find the general form of the vextex based on the values of a, b, and c, and investigate...
American Statistical Association
Scatter It! (Using Census Results to Help Predict Melissa’s Height)
Pupils use the provided census data to guess the future height of a child. They organize and plot the data, solve for the line of best fit, and determine the likely height and range for a specific age.
American Statistical Association
How Tall and How Many?
Is there a relationship between height and the number of siblings? Classmates collect data on their heights and numbers of brothers and sisters. They apply statistical methods to determine if such a relationship exists.
Texas Instruments
Vandalism 101
Learners explore logic and use Geometer’s Sketchpad and patterns of logic to solve a puzzle.
Illustrative Mathematics
Setting Goals
Setting financial goals is a common occurrence in middle school that your learners can practice using this activity. They will be able to solve for how many hours Seth needs to work to save up for a skateboard, helmet, and trip. The...


