Curated OER
Perfect Shuffles
Students investigate piecewise functions. For this algebra lesson, students model piecewise functions in the real world. They graph the parts of the functions following the restrictions of the domain.
Curated OER
Introduction to Solving Quadratic Equations by Factoring
Students solve quadratic equations. In this algebra lesson, students factor and graph linear and quadratic functions. They identify the standard and linear form of each equation.
Texas Instruments
Vandalism 101
Learners explore logic and use Geometer’s Sketchpad and patterns of logic to solve a puzzle.
Virginia Department of Education
Solving and Graphing Inequalities
You can't go wrong with a lesson that involves candy! Learners solve and graph one-variable inequalities and use candy to graph the solution. Individuals associate open circle graphs with life savers and closed circle graphs with round...
Curated OER
Logarithmic Transformations of Data
Students investigate and study logarithmic equations. In this precalculus instructional activity, students analyze the data behind the function. They define each graph as positive, negative or no correlation. They find the line of best fit.
Curated OER
Moving Straight Ahead
Students analyze the relationship between speed, time and distance. In this math lesson, students plan a school trip. Students determine the efficiency and cost effectiveness of a trip.
Curated OER
Reading Graphs
Students practice plotting functions on the Cartesian coordinate plane, see several categories of functions, including lines and parabolas, and read a graph, answering questions about the situation described by the graph
Curated OER
Reading Graphs
Students plot functions on the Cartesian coordinate plane. They explore lines and parabolas. Students analyze graphs and answer questions about the information presented on the graph using an online program.
Curated OER
Saving the Bald Eagle
Students plot on a coordinate plane. In this algebra lesson, students identify points on a coordinate plane and graph lines given coordinate pairs. They create a model as they study bald eagles and their growth and decay.
Curated OER
Position and Piecewise Velocity
Students solve piecewise functions. In this precalculus lesson plan, students model real life scenarios using velocity and piecewise. They create velocity graphs and find the beginning and end position of an object.
Curated OER
Race The Rapper: Slopes
Students calculate the slope of the equation For this algebra lesson, students graph coordinate pairs of linear equations and identify the relationship between x and y values and slope. They differentiate between functions and...
Curated OER
The Mandelbrot Set
Students are introduced to the notion of a complex number and function iteration in order to motivate the discussion of Julia sets and the Mandelbrot set.
Curated OER
Quadratics: Polynomial Form
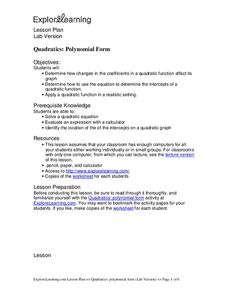
Students determine how to use the polynomial form of a quadratic equation to find the location of the vertex on a graph. They determine how changes in the coefficients in a quadratic function affect its vertex on a graph. Students find...
Curated OER
Slip Slide'n Away
Young scholars analyze the sliding of boxes along a warehouse floor. In this algebra lesson, students connect math and physics by calculating the friction created by the sliding of each box. They develop faster method to move the box,...
Curated OER
Quadratics: Polynomial Form
Students determine how changes in the coefficients in a quadratic function affect its graph. They determine how to use the equation to determine the intercepts of a quadratic function. Students identify the location of the intercepts...
Curated OER
Whose Line is it Anyway?
Students solve systems of equations. In this algebra lesson, students identify the domain and range of each function. They use the slope and y-intercept to graph each line.
Curated OER
Quadratics: Polynomial Form
High schoolers determine how changes in the coefficients in a quadratic function affect its graph. They Solve a quadratic equations. Students Determine how to use the equation to determine the intercepts of a quadratic function. They...
Curated OER
Lesson Plan On Fran Data
Seventh graders investigate the concept of functions and how they are used in the context of the real world while identifying the dependent and independent variables. They graph relations and functions and find the zeros of functions....
Curated OER
Introduction To Data Analysis
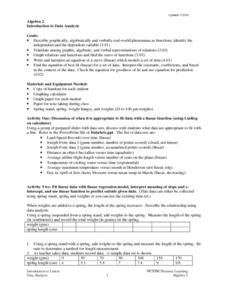
Seventh graders investigate the concept of looking at the data put in a variety of ways that could include graphs or data sets. They analyze data critically in order to formulate some sound conclusions based on real data. Students graph...
Curated OER
Describing Data
Your learners will practice many ways of describing data using coordinate algebra in this unit written to address many Common Core State Standards. Simple examples of different ways to organize data are shared and then practice problems...
Inside Mathematics
Coffee
There are many ways to correlate coffee to life, but in this case a worksheet looks at the price of two different sizes of coffee. It requires interpreting a graph with two unknown variables, in this case the price, and solving for those...
Radford University
A Change in the Weather
Explore the power of mathematics through this two-week statistics unit. Pupils learn about several climate-related issues and complete surveys that communicate their perceptions. They graph both univariate and bivariate data and use...
American Statistical Association
Scatter It! (Predict Billy’s Height)
How do doctors predict a child's future height? Scholars use one case study to determine the height of a child two years into the future. They graph the given data, determine the line of best fit, and use that to estimate the height in...
Explore Learning
Quadratics: Polynomial Form
Throught this subscription-based sight, learners explore different aspects of the parabola by changing equations from standard to vertex form. Next, find the general form of the vextex based on the values of a, b, and c, and investigate...


