Virginia Department of Education
Solving and Graphing Inequalities
You can't go wrong with a lesson that involves candy! Learners solve and graph one-variable inequalities and use candy to graph the solution. Individuals associate open circle graphs with life savers and closed circle graphs with round...
Curated OER
Linear Functions
In this algebra learning exercise, students identify and label functions as linear or not. They find the domain and range of each function. There are 15 multiple choice questions.
Mathematics Vision Project
Module 4: Linear and Exponential Functions
Sequences and series are traditionally thought of as topics for the pre-calculus or calculus class, when learners are figuring out how to develop limits. But this unit uses patterns and slopes of linear functions in unique ways to bring...
Charleston School District
Sketching a Piecewise Function
How do you combine linear and nonlinear functions? You piece them together! The lesson begins by analyzing given linear piecewise functions and then introduces nonlinear parts. Then the process is reversed to create graphs from given...
EngageNY
Graphs of Piecewise Linear Functions
Everybody loves video day! Grab your class's attention with this well-designed and engaging resource about graphing. The video introduces a scenario that will be graphed with a piecewise function, then makes a connection to domain...
Inside Mathematics
Graphs (2006)
When told to describe a line, do your pupils list its color, length, and which side is high or low? Use a worksheet that engages scholars to properly label line graphs. It then requests two applied reasoning answers.
Curated OER
US Airports, Assessment Variation
Determining relationships is all part of algebra and functions. Your mathematicians will decide the type of relationship between airports and population and translate what the slope and y-intercept represent. The problem is multiple...
EngageNY
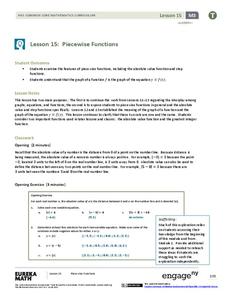
Piecewise Functions
Show your class members that if they can graph a linear function, they can graph an absolute value function. Groups create an absolute value graph using a table, then entertain the idea of an absolute value function defined as two pieces...
SHS Algebra
Transformations of Linear and Exponential Graphs
Your transformers will create and analyze graphs to discover which operations produce which transformations. Linear and exponential functions are used to model the transformations.
University of North Texas
Library of Functions
Join the family picnic and see how all the functions come together in a PowerPoint that highlights their main features. As it includes topics such as domain, range, and intercepts, the slides are a great guide to promote class discussions.
Shodor Education Foundation
Function Flyer
Fly through graphing functions with the Function Flyer. Young mathematicians use an interactive to graph different types of functions. A set of exploration questions has users investigate patterns in functions.
Desmos
Desmos Graphing Calculator
They say a graph is worth a thousand points. The interactive allows users to graph a wide variety of functions and equations. Using the included keyboard or typing directly into the list, learners determine the graph of a function....
Curated OER
Functions - Intro and Inverses
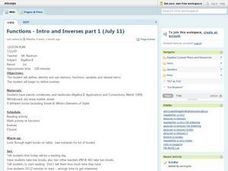
Define the terms domain, range, function, vertical limit test, and linear function notation with your class. They can then, graph several equations applying the vertical line test to determine which are and which are not functions, write...
GeoGebra
GeoGebra Graphing Calculator
So, exactly, what does it look like? The easily usable graphing calculator allows pupils to visualize the graph of equations and inequalities. The interactive supports any algebraic graph needed for high school mathematics and then some.
Inside Mathematics
Sorting Functions
Graph A goes with equation C, but table B. The short assessment task requires class members to match graphs with their corresponding tables, equations, and verbalized rules. Pupils then provide explanations on the process they used to...
Charleston School District
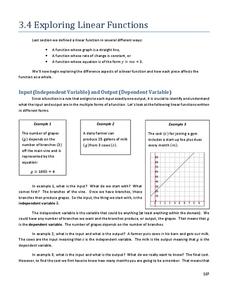
Exploring Linear Functions
What does a graph or equation say about a situation? Lots! The lesson uses the concepts explored in the previous four lessons in the series and applies them to problem solving situations. Learners create an equation from problems posed...
Curated OER
Building a Quadratic Function Form
Comparing the movement of graphs geometrically when small changes are made to the parent function motivates this collaborative discussion on the transformations of functions to their various forms. Vertical and horizontal shifts due to...
Curated OER
Interactivate: Introduction to Functions
This interactive website provides a variety of lesson plans according to which standards you are applying and which textbook you use. Introduce functions to your class by having them construct single operation machines and create...
Curated OER
Linear Inequalities
Through exploration of linear programming through graphs and equations of inequalities, students relate linear programming to real life scenarios, such as business. Graphing and shading is also part of this exercise.
Balanced Assessment
Garages and Phones
Examine and compare a linear and step function. The task provides two scenarios, one modeled by a linear function and the other a step function. Pupils create a graph for each and explain how each compares to the other.
Howard County Schools
To Babysit or Not to Babysit?
Would you work for a penny today? Use this activity to highlight the pattern of increase in an exponential function. Scholars compare two options of being paid: one linear and one exponential. Depending on the number of days worked, they...
Curated OER
Compound Inequalities and Graphing
Put geometry skills to the test! Learners solve compound inequalities and then graph the inequalities on a coordinate plane using their geometric skills. They identify the slope and y-intercept in order to graph correctly. I like this...
Curated OER
Graphs and Functions
Middle schoolers describe plotting functions on the Cartesian coordinate plane. They solve functions on paper and using an online tool to plot points on a Cartesian coordinate plane creating lines and parabolas.
Mathematics Vision Project
Module 2: Linear and Exponential Functions
Write, graph, and model all things linear and exponential. Building on the previous module in a nine-part Algebra I series, learners compare linear exponential modeling. They write equations, graph functions, and analyze key features.


