Curated OER
Decode Word Is..
Students solve problems using patterns. In this algebra lesson, students identify the relation, domain and range of a function. They graph functions using coordinate pairs.
Curated OER
Discovering Growth Patterns
Students explain the differences between linear (arithmetic) and exponential (geometric) growth. They use worksheets imbedded in this instructional activity to help them make predicitions and graph data points.
Curated OER
Exploring F function Graphs
Using three set of data that relate temperature to another variable, 10th graders will use graphs, tables, or equations to make predictions about data. Students will identify the relations as linear or non-linear. Students will define...
Curated OER
Linear Graphs and Equations
In this linear graph and equations worksheet, students calculate the gradient of slopes, and find equations of lines in patterns.
Curated OER
Discovering the Linear Relationship between Celsius and Fahrenheit
Students discover the linear relationship between degrees Farenheit and degrees Celsius. They manually compute the slope and y-intercept of the line passing through points. They convert Celsius to Fahrenheit degrees.
Curated OER
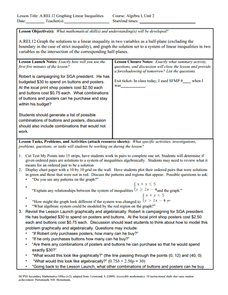
Graphing Linear Inequalities
Eighth graders extend skills for representing and solving linear equations to linear inequalities. Lesson activities build understanding and skill by plotting ordered pairs of numbers that either satisfy or do not satisfy a given...
Curated OER
Sequences and Linear Equations
Students identify the formula to find the nth term. In this algebra lesson, students finish a pattern and identify missing parts in a sequence. They write an equation given a partial sequence.
Curated OER
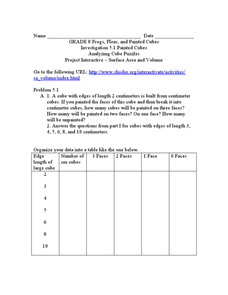
Analyzing Cubes
For this analyzing cubes worksheet, 9th graders solve and complete 6 different types of problems. First, they organize the given data into the table provided. Then, students study the patterns in the table and tell whether the pattern of...
Curated OER
Thirst Dilemma (Drinking in the Desert)
Ninth graders explore linear functions. In this Algebra I lesson, 9th graders collect and analyze date as they investigate the question of how long will water last if you are trapped in a desert. Students create...
Curated OER
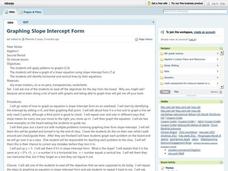
Algebra: Linear Equations
Young scholars draw graphs of linear equations using the slope intercept form. Upon completion of various problems, students record their answers on the board and explain the solutions to classmates. Young scholars take a test over...
Curated OER
Causal Patterns in Air Pressure Phenomena
Students explore air pressure. They observe what happens when you drink from a straw. Students experiment and create models to prove examine air pressure and vacuums. Sstudents contrast how linear and relational casusal models explain...
Curated OER
Marcy's Dots
Pupils identify the pattern changes that could occur in a series using pictures with dots. They use the patterns on the worksheets to have a context to describe pattern in words. Students look to find the linear, quadratic, or...
Curated OER
Interactive Tutorial on Inheritance Patterns Using Hypercard
Young scholars participate in an interactive tutorial program designed to directly observe a variety of inheritance patterns. They select problems relating to genetics. They perform a calculation and receive feedback to reinforce their...
5280 Math
Go with the Flow
Round and round they go ... where they stop, only scholars will know. By writing systems of equations, classes determine the number of cars a roundabout can handle given specific constraints. Systems use up to six variables and become...
EngageNY
Analyzing Residuals (Part 1)
Just how far off is the least squares line? Using a graphing calculator, individuals or pairs create residual plots in order to determine how well a best fit line models data. Three examples walk through the calculator procedure of...
EngageNY
Analyzing a Data Set
Through discussions and journaling, classmates determine methods to associate types of functions with data presented in a table. Small groups then work with examples and exercises to refine their methods and find functions that work...
101 Questions
Coins in a Circle
Round and round you'll go! Learners watch as different-sized circles fill with coins. They collect data and then make a prediction about the number of coins that will fit in a large circular rug.
Curated OER
The Window Problem
Learners identify patterns and compute formulas to solve the problems. In this algebra lesson, students come up with a rule given a pattern, and analyze the relationship between data and graphs.
Curated OER
Strike a Pose: Modeling in the Real World (There's Nothing to It!)
Adjust this lesson to fit either beginning or more advanced learners. Build a scatter plot, determine appropriate model (linear, quadratic, exponential), and then extend to evaluate the model with residuals. This problem uses real-world...
Curated OER
Cantilevers
Young scholars perform an experiment to find the linear relationship between the appllied weight and the bend of the cantilever. In this linear relationships lesson, students follow detailed directions to set up an experiment. They add...
Curated OER
Linear and Nonlinear Functions
Students identify properties of a line. In this algebra lesson, students differentiate between functions and nonfunctions. They use the slope and y intercept to graph their lines.
Curated OER
How Do They Relate? Linear Relationship
Students collect information and use a line to represent it. In this algebra activity, students investigate real world data to see if it makes a line. They graph the line comparing the relationship of the x axis with that of...
Curated OER
8.SP.1Texting and Grades I
Here is a fitting question for middle schoolers to consider: Is there a relationship between grade point average and frequency of sending texts? Starting statisticians examine a scatter plot and discuss any patterns seen.
Teachers Network
A World of Symmetry: Math-Geometry
Define and identify the three basic forms of symmetry translation, rotation, and glides with your class. They cut out and arrange paper pattern blocks to illustrate symmetry, create a Cartesian graph, and design a rug with a symmetrical...
Other popular searches
- Linear Patterns Word Problem
- Linear Patterns Graphing
- Linear Patterns and Graphs
- Linear Patterns and Plotting
- Algebra Linear Patterns
- Describing Linear Patterns
- Linear Patterns in Data
- Recognize Linear Patterns
- Extending Linear Patterns
- Growing Linear Patterns
- Simple Linear Patterns
- Non Linear Patterns


