National Council of Teachers of Mathematics
Stitching Quilts into Coordinate Geometry
Who knew quilting would be so mathematical? Introduce linear equations and graphing while working with the lines of pre-designed quilts. Use the parts of the design to calculate the slope of the linear segments. The project...
Curated OER
Profitable Soda Stand
Am I making any money? Help learners determine if their fictitious soda stand is turning a profit. They graph linear equations using the slope and y-intercept and identify the best price to use to sell soda. They identify the domain and...
Curated OER
Graphing Inequalities in Two Variables
This study guide is a great resource to help you present the steps to graphing linear inequalities. Show your class two different ways to graph an inequality and work on a real-world example together. The document could also be easily...
Curated OER
Explore Subtraction
Learnersare given 26 tables and graphs in which they must fill in missing numbers and graph equations. They subtract a given value of x from a constant number, and use a number line to subtract larger numbers from smaller ones resulting...
Curated OER
Peter's Third String
Explore the solution to a word problem involving area and perimeter. Learners read and discuss how to approach the problem. In small groups, they determine the maximum area of a rectangle with a given perimeter using a piece of string....
Curated OER
Linear Graphs and Patterns
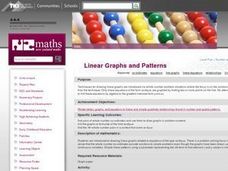
Fifth graders find pairs of whole number co-ordinates and use them to draw graphs in problem contexts. They find and interpret the all meaningful pairs of whole number co-ordinates from graphs.
University of Utah
Representations of a Line
Line up to learn about lines! Scholars discover how to express patterns as linear functions. The workbook then covers how to graph and write linear equations in slope-intercept form, as well as how to write equations of...
Alabama Learning Exchange
Bloodstain Pattern Doesn't Lie......
An interesting instructional activity on hypothesizing about the diameter of a drop of blood that is splattered. To test their theories, learners work in groups to make blood droplets splatter from different heights. They use graphed...
Curated OER
Writing Linear Equations in Different Forms
Can your class write linear equations three different ways? Here is a study guide that includes slope-intercept, standard, and point-slope forms. Learners are given the slope and a point on the line, or two points and are asked to write...
Curated OER
Data and Scientific Graphs
Students conduct experiments and graph their data. In this statistics lesson plan, students collect data and graph it on a coordinate plane. They analyze the data looking for patterns and they discuss their findings with the class.
Curated OER
Graphs involving Exponential Functions
In this algebra worksheet, learners graph exponential functions and analyze it for growth and decay. There are 9 problems with an answer key.
Virginia Department of Education
Slippery Slope
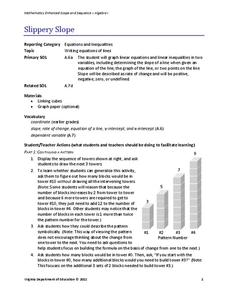
Explore slope using geometric patterns. Young mathematicians investigate towers built from cubes to develop a linear pattern. They move the data to a coordinate plane to connect the pattern to slopes.
Inside Mathematics
Squares and Circles
It's all about lines when going around. Pupils graph the relationship between the length of a side of a square and its perimeter. Class members explain the origin in context of the side length and perimeter. They compare the graph to the...
Mathematics Assessment Project
Shelves
Don't leave this task on the shelf — use it is assess middle schoolers understanding of patterns. Participants try to discover a pattern in the number of bricks and planks used to make shelves. They then match descriptions...
American Statistical Association
What Fits?
The bounce of a golf ball changes the result in golf, mini golf—and a great math activity. Scholars graph the height of golf ball bounces before finding a line of best fit. They analyze their own data and the results of others to better...
EngageNY
Analyzing Residuals (Part 1)
Just how far off is the least squares line? Using a graphing calculator, individuals or pairs create residual plots in order to determine how well a best fit line models data. Three examples walk through the calculator procedure of...
Concord Consortium
Functions by the Slice
Piece by piece ... dismantling a function can highlight interesting patterns. The task asks learners to slice functions in sections with the same vertical change. They then recreate the graph with these slices positioned horizontally....
Balanced Assessment
Telephone Service
Class members must determine the best phone plan for customers. by assessing three different phone plans. Each plan price depends not only the number of minutes, but also the location of the calls — bringing in a third variable. Scholars...
Noyce Foundation
Toy Trains
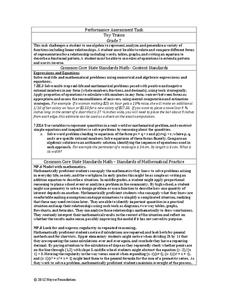
Scholars identify and continue the numerical pattern for the number of wheels on a train. Using the established pattern and its inverse, they determine whether a number of wheels is possible. Pupils finish...
Mathematics Vision Project
Quadratic Functions
Inquiry-based learning and investigations form the basis of a deep understanding of quadratic functions in a very thorough unit plan. Learners develop recursive and closed methods for representing real-life situations,...
Inside Mathematics
Hexagons
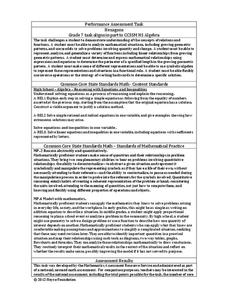
Scholars find a pattern from a geometric sequence and write the formula for extending it. The worksheet includes a table to complete plus four analysis questions. It concludes with instructional implications for the teacher.
Howard County Schools
To Babysit or Not to Babysit?
Would you work for a penny today? Use this activity to highlight the pattern of increase in an exponential function. Scholars compare two options of being paid: one linear and one exponential. Depending on the number of days worked, they...
Curated OER
Graphing Linear Functions
Seventh graders identify the use of a function.They are asked to describe the input and output of a function. Students also identify different aspects of the coordinate system and represent functions in a visual graph.
Curated OER
Finding Patterns and Graphing Functions
Young scholars investigate patters for area and perimeter. In this Algebra I/Geometry lesson, students explore two different patterns as they write a formula for the nth term of each pattern. Young scholars graph their results and...


