Curated OER
Tune...Um!
Students collect real data on sound. In this algebra lesson, students use a CBL and graphing calculator to observe the graph created by sound waves. They draw conclusion about the frequency of sound from the graph.
Curated OER
The Binary Counter Circuit
Students count from 0-99 using the binary number system. In this algebra lesson, students problem solve by working with faulty circuits and applying their knowledge f Binary Numbers. They work in team to create a solution.
Curated OER
Cruising the Internet
Students identify the parts of an engine using a graph. In this statistics lesson, students make a graph from their collected data. They calculate the volume of a cylinder using a line of regression and a scatter plot.
Curated OER
Potential and Kinetic Energy
Sixth graders explore potential and kinetic energy. In this science lesson, 6th graders assume the role of a roller coaster engineer and design a roller coaster. Students use their knowledge of kinetic and potential energy to design a...
Curated OER
Venn Diagram Lesson Plan
Students use Venn diagrams in order to classify different objects and numbers. They then use "Venn Diagram Shape sorter" applets on the computer.
Curated OER
Warm and Cold Air
Learners examine what happens to air when it is heated or cooled. They conduct an experiment using bottles and balloons, record and discuss their observations, and write a hypothesis.
Curated OER
What is a Cloud
Third graders study clouds and how they are formed. They write acrostic poems about clouds and analyze and graph temperature data collected during varying degrees of cloud cover.
Curated OER
Cloud Discovery
Students create a slideshow that pictorially depicts a variety of cloud types. They research clouds, develop and present the slideshow and then evaluate their efforts based on a rubric for self-evaluation.
Curated OER
Cloud Shadows
Students classify clouds as transparent, translucent or opaque. They conduct an experiment to determine the visual opacity of several classroom objects and then conduct further observations of clouds.
Curated OER
Graphing Data - Temperature
Seventh graders measure and record temperature over a given time period. They compare the recorded temperatures to the 40-year recorded normal average temperatures for the same area. Students display and interpret their findings in a graph.
Curated OER
Cloud Databases
Young scholars complete a unit on clouds and a report about one type of cloud. They collect data through observation about different types of cloud cover and then create a spreadsheet to reflect their observations over a 2 week period.
Curated OER
Oxygen vs. Air Pressure
Students conduct an experiment to determine if water level is affected by a change in oxygen level or air pressure.
Curated OER
Venn Diagram with Blocks
Fifth graders classify blocks according to their attributes. In this math lesson, 5th graders will identify attributes of blocks, sort them, then form the groups into a Venn Diagram, and write ratios using the attributes.
Curated OER
Science: Trouble in the Troposphere
Students research a NASA Website and record information about an assigned city's tropospheric ozone residual monthly climate. In groups, they graph the information for the past year. They form new groups and compare their city's...
Curated OER
Piece of the Sky: Introduction for Making S'COOL Observations
Students observe and discuss cloud cover. They identify percent of cloud cover, calculate cloud cover by fraction and convert to a percent, and compare their models with the current real sky cloud cover.
Curated OER
Wind
Fourth graders watch an experiment that demonstrates the causes of wind. They design and make an original weather craft.
Curated OER
Cloud Observation and Graphing
Students identify the three major cloud groups. They are introduced to the three main cloud types and spend a week making and recording observations of clouds. Students produce a graph that presents their findings and conduct research...
Curated OER
Comparing Weather Conditions
Young scholars conduct research on temperature, wind speed and weather conditions from a variety of areas. They organize their findings on worksheets and spreadsheets and discuss various examples of databases.
Curated OER
Creating a Thematic Map Using S'COOL Data
Students observe weather patterns, collect data, and make a weather predictions for various locations on a map.
Curated OER
Examine Persuasive Elements by Reading, Analyzing, and Discussing Persuasive Text
Students identify persuasive strategies and analyze arguments. In this persuasive writing instructional activity, students read "Chief Red Jacket's Reply" and "Reverend Cram's Speech to the Iroquois Nation" and chart major elements of...
Curated OER
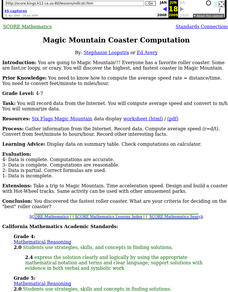
Magic Mountain Coaster Computation
Students use the Internet to do research on the roller coasters at Magic Mountain Amusement Park. They must use mathematical formulas to calculate the highest and fastest coaster at the park.
Curated OER
Classifying Resources
Learners discuss the difference between the three types of productive resources. In groups, they classify and organize examples into the correct category on a chart. As a class, they discuss how each type is used in the production of a...
Curated OER
Taxes
Learners use the internet to examine the various types of taxes. Using this information, they develop a chart comparing and contrasting the types and determinations of how much tax needs to be paid. They share their charts with the...
Curated OER
Social Studies: Candidate Issue Positions
Students examine the positions of candidates on various issues. Using visual displays, they describe the platforms and positions of candidates on specific issues. Students include opposing views in their displays from other candidates.
Other popular searches
- Math Logical Reasoning
- Logical Reasoning in Math
- Logical Reasoning Activity
- Logical Reasoning Statements
- Using Logical Reasoning
- Logical Reasoning 5th
- Logical Reasoning Worksheets
- Math Logical Reasoning 5th
- Logical Reasoning Ell
- Teaching Logical Reasoning
- Logical Reasoning Math Venn


