Curated OER
The New Deal
Students practice their reading comprehension skills by reading about Franklin Roosevelt and the New Deal programs. They answer questions related to the reading to test for comprehension.
Curated OER
Understanding Celsius
Student read both Celsius and Fahrenheit temperatures on thermometers. They covert the temperatures and write poems to show understanding.
Curated OER
Weather Predictions
Students record weather data and create a five day forecast. Students investigate the roles of meteorologists and identify symbols used on a weather map. After gathering weather data for a week, students will create a five day forecast...
Curated OER
Eratosthenes And Radius of the Earth
Learners calculate the radius of the earth. They use the method and data suggested by Eratosthenes. They investigate the interrelationships among mass, distance, force, and time through experimental processes.
Curated OER
I Heard the Owl Call My Name
Tenth graders read I Heard the Owl Call My Name by Margaret Craven. They share interpretations and conclusions in either oral or written form. They deliver a speech that conveys information using clear and concise language.
Curated OER
Hunger/ Nutrition
Seventh graders investigate nutrients and nutrition to determine what types of food the body needs for energy. They study each type of nutrient and why it is important to the body. They determine what a balanced diet is by completing the...
Curated OER
Equations
Fourth graders determine the difference between equations and non-equations. In groups, they are given the answers and identify the numbers needed to make the answer. To end the lesson, they complete an equation using the price lists...
Curated OER
Measuring Pattern Block Angles
Sixth graders review the rotation of 180 and 360 degrees. Using the alphabet, they estimate the angle degree and identify the angles as either right, straight, obtuse or acute. In groups, they measure the pattern block angles and record...
Curated OER
A New Society Project
Ninth graders examine the social and political movements of the Gilded Age and Progressive Era. In this American history lesson, 9th graders work in groups to form their own society and laws. Students make a diagram of their town and...
Curated OER
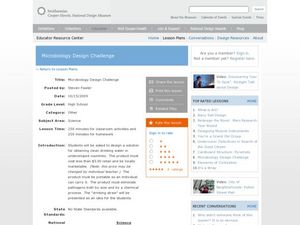
Microbiology Design Challenge
Students discover dangers to human health by researching what's in our drinking water. In this water purification lesson, students discuss the conditions of water in undeveloped countries and why it is unsafe to drink. Students work in...
Curated OER
A to Z Observations
Eighth graders examine the cultural conflicts that occurred when Europeans moved into the land the Native Americans lived on that would become West Virginia. In this West Virginia history lesson, 8th graders visit the state history...
Curated OER
How Big Is It?
Fifth graders look at the Garrison flag and estimate how big it is. For this measurement lesson plan, 5th graders then calculate the area and perimeter of the flag.
Curated OER
Who Does the Lottery Benefit?
Students investigate the pros and cons of the lottery. In this algebra lesson, students use the formulas for permutation and combination to test their arguments about the lottery. They collect data about their argument and plot it on a...
Curated OER
The Binary Counter Circuit
Students count from 0-99 using the binary number system. In this algebra activity, students problem solve by working with faulty circuits and applying their knowledge f Binary Numbers. They work in team to create a solution.
Curated OER
Cruising the Internet
Students identify the parts of an engine using a graph. In this statistics lesson, students make a graph from their collected data. They calculate the volume of a cylinder using a line of regression and a scatter plot.
Curated OER
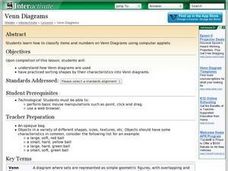
Venn Diagram Lesson Plan
Students use Venn diagrams in order to classify different objects and numbers. They then use "Venn Diagram Shape sorter" applets on the computer.
Curated OER
Graphing Data - Temperature
Seventh graders measure and record temperature over a given time period. They compare the recorded temperatures to the 40-year recorded normal average temperatures for the same area. Students display and interpret their findings in a graph.
Curated OER
Cloud Databases
Learners complete a unit on clouds and a report about one type of cloud. They collect data through observation about different types of cloud cover and then create a spreadsheet to reflect their observations over a 2 week period.
Curated OER
What is a Cloud
Third graders study clouds and how they are formed. They write acrostic poems about clouds and analyze and graph temperature data collected during varying degrees of cloud cover.
Curated OER
Cloud Discovery
Students create a slideshow that pictorially depicts a variety of cloud types. They research clouds, develop and present the slideshow and then evaluate their efforts based on a rubric for self-evaluation.
Curated OER
Piece of the Sky: Introduction for Making S'COOL Observations
Learners observe and discuss cloud cover. They identify percent of cloud cover, calculate cloud cover by fraction and convert to a percent, and compare their models with the current real sky cloud cover.
Curated OER
Science: Trouble in the Troposphere
Students research a NASA Website and record information about an assigned city's tropospheric ozone residual monthly climate. In groups, they graph the information for the past year. They form new groups and compare their city's...
Curated OER
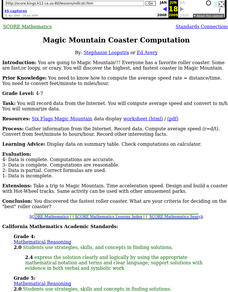
Magic Mountain Coaster Computation
Students use the Internet to do research on the roller coasters at Magic Mountain Amusement Park. They must use mathematical formulas to calculate the highest and fastest coaster at the park.
Curated OER
Creating a Thematic Map Using S'COOL Data
Students observe weather patterns, collect data, and make a weather predictions for various locations on a map.


