Curated OER
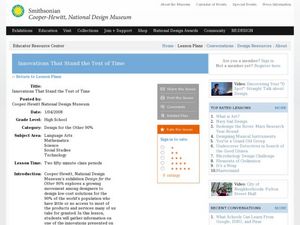
Innovations That Stand the Test of Time
Students create a class presentation that explains the value of an innovation to society. In this design innovation lesson, students discuss relationships among math, science, technology, and engineering, read a story about design...
Curated OER
Understanding Celsius
Student read both Celsius and Fahrenheit temperatures on thermometers. They covert the temperatures and write poems to show understanding.
Curated OER
Aruba Cloud Cover Measured by Satellite
Students analyze cloud cover and to compose written conclusions to a given related scenario. They submit a letter of response and a report detailing their calculations and conclusions.
Curated OER
Fractions
Fourth graders explore fractions. They use Skittles and M&M's to practice adding and subtracting fractions. Students review the numerator and the denominator of fractions. They count the number of each color of Skittles and M&M's...
Curated OER
Planning a Trip
Students plan a trip to from 3 to 5 cities of their choice. They design a brochure to travel to the chosen cities. It should be of a quality that it could be used by a customer to decide if they would like to take this trip.
Curated OER
Congruent Triangles Postulates
Students discover three lettered postulates that prove triangles congruent.
Curated OER
Making Shapes
Tenth graders construct geometric figures using compasses and protractors.
Curated OER
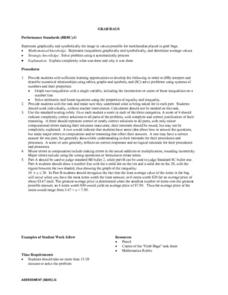
Grab Bags
Eighth graders graph two inequalities with a single variable. They include drawing the intersection or union of inequalities on a number line. Students solve the linear equations using properties of equality and inequality. The lesson...
Curated OER
Graphing Data - Temperature
Seventh graders measure and record temperature over a given time period. They compare the recorded temperatures to the 40-year recorded normal average temperatures for the same area. Students display and interpret their findings in a graph.
Curated OER
Aruba Cloud Cover Measured by Satellite
Students analyze cloud cover over Aruba. They compose and submit written conclusions which include data, analysis, errors in data collection, and references.
Curated OER
Habitats: Rainforest
Pupils use the internet to find reasons the rainforest is endangered and ways that affects the rest of the world. They read for information, perform experiments, locate rainforests on maps, and write about this ecosystem.
Curated OER
Circle the Earth - Explore Surface Types on a Journey around Earth
Students use CERES percent coverage surface data with a world map in locating landmasses and bodies of water at Earth's Equator.
Curated OER
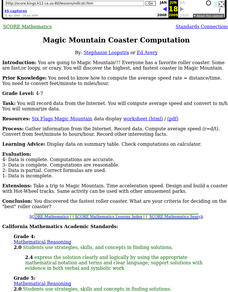
Magic Mountain Coaster Computation
Students use the Internet to do research on the roller coasters at Magic Mountain Amusement Park. They must use mathematical formulas to calculate the highest and fastest coaster at the park.
Curated OER
Graphing With RXTE
High schoolers use data from the Rossi X-ray Tiiming Explorer (RXTE) satellite to analyze and graph.
Curated OER
The 500 Problem
Young scholars explain face, place and total value of numbers as well as solve three-digit subtraction problems. Before trying answer the problem Students must be able to examine that the same digit is used to represent different amounts.
Curated OER
Strawberry Milk
Students work in groups or alone to solve the problem. They use a systematic approach to get all possible answers. They report back to the class with solutions. They may extend their studying using a crate with room for 9 bottles.
Curated OER
Brian's Pegboard II
Students are able to assess a problem and use systematic methods to solve the problem. They also find out all the possible outcomes for a sequence of events using tree diagrams.
Curated OER
Graphing Heart Rates
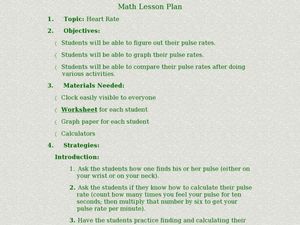
Young scholars explore heart rates. They record pulse rates, predict which exercises cause a faster heart rate, make a chart, and graph the results. Students write an essay using the data to support their predictions. They write a...
Curated OER
Probability, Genetics and the Human Condition
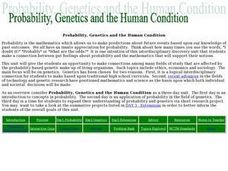
Students explore the concept of probability as it relates us to be able to make predictions about future events based upon our knowledge of past outcomes. They have an innate appreciation for probability. Students make a connection...
Curated OER
Does Cloud Type Affect Rainfall?
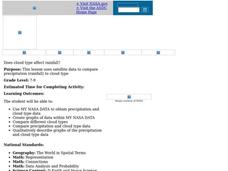
Student uses MY NASA DATA to obtain precipitation and cloud type data. They create graphs of data within MY NASA DATA. They compare different cloud types as well as precipitation types. They describe graphs of the precipitation and cloud...
Curated OER
Ocean Currents and Sea Surface Temperature
Students use satellite data to explore sea surface temperature. They explore the relationship between the rotation of the Earth, the path of ocean current and air pressure centers. After studying maps of sea surface temperature and ocean...
Curated OER
Concrete Canoes
Students explore and analyze the relationship of buoyancy and displacement needed to make an object float. They examine various boat designs, then design and build clay and aluminum boats that hold a cargo of marbles.
Curated OER
Piece of the Sky: Introduction for Making S'COOL Observations
Learners observe and discuss cloud cover. They identify percent of cloud cover, calculate cloud cover by fraction and convert to a percent, and compare their models with the current real sky cloud cover.


