Shodor Education Foundation
Sets and the Venn Diagram (Beginner)
Venn diagrams are helpful in understanding the idea of a set and using attributes to sort items. This basic plan is an introduction with an added bonus of an applet that can be used to demonstrate the activity. If a classroom of...
California Education Partners
Improving Our Schools
Split the work three ways. Learners use their knowledge of fractions to solve problems dealing with splitting up work loads evenly between three groups. Scholars determine the fractional portion of work each group will do along with...
California Education Partners
Science Fair Project
Plant the data firmly on the graph. Given information about the growth rate of plants, pupils determine the heights at specific times and graph the data. Using the information, scholars determine whether a statement is true and support...
Curated OER
Perceived Risks
Learners rank a list of everyday risks to compare with classmates. They rate each risk on both its ability to be controlled and its observability in the environment. Results are graphed.
Google
Surveys and Estimating Large Quantities
Looking for an estimation activity a bit more involved than the typical "guess the number of jellybeans in the jar" game? Here, learners use a picture to estimate the number of people at a large event, look for potential problems with...
Bowland
Magic Sum Puzzle
Learners discover the magic in mathematics as they solve numerical puzzles involving magic sums. They then make a conjecture as to why no additional examples are possible based on an analysis of the puzzles.
West Contra Costa Unified School District
Investigating Special Right Triangles
Scholars first investigate relationships in the side lengths of 30°-60°-90° triangles and 45°-45°-90° triangles. This knowledge then helps them solve problems later in the lesson about special right triangles.
Bowland
Fish Dish
Minimize the time it takes to create a fish dish. Scholars use their knowledge of time to devise an order that accounts for different constraints. Considering jobs that can be done in parallel is essential to solving the problem.
Shodor Education Foundation
InteGreat
Hands-on investigation of Riemann sums becomes possible without intensive arithmetic gymnastics with this interactive lesson plan. Learners manipulate online graphing tools to develop and test theories about right, left, and midpoint...
Curated OER
"A Slice of the Cone"
Here is a set of lessons that explore conics in a number of different ways. Starting with modeling how a conic is produced by the way a plane cuts the cone, to solving complex word problems, algebra learners progress through a series of...
PBS
Patterns to the Rescue!
Track down the Cyberchase episode that this lesson is associated with. Using a worksheet that is embedded in the plan, learners must find the next two numbers and shapes (a double pattern). Once these have been discovered, pupils try...
Curated OER
NIGHT AND DAY: DAILY CYCLES IN SOLAR RADIATION
High schoolers examine how Earth's rotation causes daily cycles in solar energy using a microset of satellite data to investigate the Earth's daily radiation budget and locating map locations using latitude and longitude coordinates.
Bowland
Hilbre Island
Young travelers plan a trip to Hilbre Island based on constraints on tides and time. They use a timeline to help determine the optimal day/time to make the trip.
Bowland
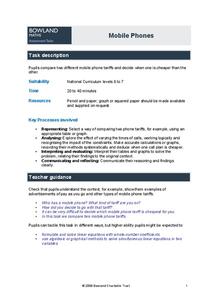
Mobile Phones
Cheaper cell phone bills? Learners compare two different cell phone plans for a specified number of minutes of phone usage each day. They also determine the conditions for which one plan is cheaper than the other.
Improving Measurement and Geometry in Elementary Schools
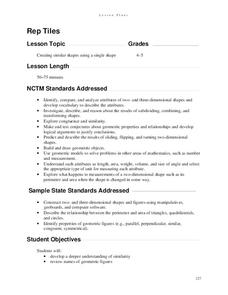
Rep Tiles
In addition to the catchy title, this lesson plan provides upper graders an opportunity to more closely scrutinize the attributes of plane figures. In particular, they focus on the similarity of different shapes. Both whole-class and...
Centre for Innovation in Mathematics Teaching
Ten Data Analysis Activities
This thirteen page data analysis worksheet contains a number of interesting problems regarding statistics. The activities cover the concepts of average measurements, standard deviation, box and whisker plots, quartiles, frequency...
Noyce Foundation
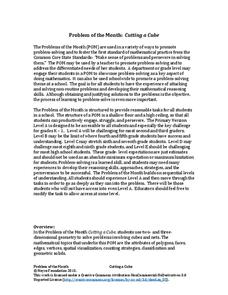
Cutting a Cube
Teach the ins and outs of the cube! A series of five K–12 level activities explore the make-up of the cube. The beginning lessons focus on the vocabulary related to the cube. Later lessons explore the possible nets that describe a cube....
Noyce Foundation
Cut It Out
Explore the mathematics of the paper snowflake! During the five lessons progressing in complexity from K through 12, pupils use spatial geometry to make predictions. Scholars consider a folded piece of paper with shapes cut out. They...
Noyce Foundation
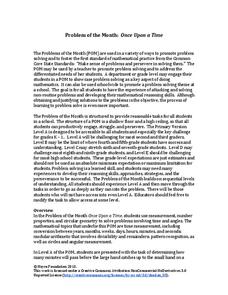
Once Upon a Time
Examine the relationship between time and geometry. A series of five lessons provides a grade-appropriate problem from elementary through high school. Each problem asks learners to compare the movement of the hands on a clock to an angle...
Noyce Foundation
On Balance
Investigate the world of unknown quantities with a creative set of five lessons that provides problem situations for varying grade levels. Each problem presents a scenario of fruit with different weights and a balance scale. Using the...
Noyce Foundation
Digging Dinosaurs
Build a function to solve problems rooted in archeology. A comprehensive set of five lessons presents problems requiring individuals to use functions. The initial lesson asks learners to find the possible number of dinosaurs from a...
Noyce Foundation
Measuring Mammals
Explore the meaning of scale and proportion with a set of five activities that examines the topic from elementary through high school. The first lessons explore ratio by examining pictures of different sizes. The next three activities...
Noyce Foundation
Measuring Up
Teach the basics of measurement and conversion with a five-lesson resource that builds an understanding of proportion and measurement conversion from elementary through high school. Initially, young scholars use ratios to determine soup...
Noyce Foundation
Through the Grapevine
Teach statistics by analyzing raisins. A thorough activity provides lesson resources for five levels to include all grades. Younger pupils work on counting and estimation, mid-level learners build on their understanding of the measures...


