Curated OER
Human Effect
Students investigate changes in air quality. In this science lesson, students compare data to determine the air quality. Students explore how humans affect the air quality.
Curated OER
Make Your Own "Weather" Map
Students develop and apply a variety of strategies to solve problems, with an emphasis on multi-step and non-routine problems. They acquire confidence in using mathematics meaningfully.
Curated OER
Baseball Challenge - Basic Geography Skills
A fabulous presentation/activity based on geography. The author has designed a "baseball game" where batters advance to the next base if they correctly answer a multiple choice question about geography. Geographic terms are used, along...
Curated OER
Design an Island
Students explore islands. They create a two- or three-dimensional map of an island. They explain how the topography of an area influences the location of water sources, ecosystems, and human settlements. Lesson includes adaptations for...
Curated OER
Natural Disasters and the Five Themes of Geography
Have your class do research on natural disasters and create a presentation using this resource. In completing this activity, learners apply the five geography themes to their research. They write a paper describing their results. It's a...
National Wildlife Federation
I Speak for the Polar Bears!
Climate change and weather extremes impact every species, but this lesson focuses on how these changes effect polar bears. After learning about the animal, scholars create maps of snow-ice coverage and examine the yearly variability and...
Mr. Head's 6th Grade Classroom
Absolute Location
How do we know where we are in the world? A presentation for middle schoolers explains absolute location and other geography terms such as relative location. It also gives scholars the opportunity to practice finding absolute location on...
Curated OER
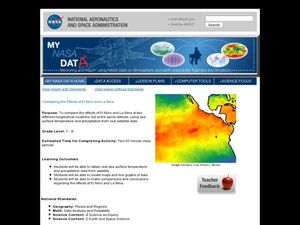
Comparing the Effects of El Nino and La Nina
Students examine the differences between an El Nino and La Nina year. In this investigative lesson students create maps and graphs of the data they obtained.
Curated OER
Solar Cell Energy Availability From Around the Country
Students determine areas that are the most likely to produce solar energy by using NASA data. In this solar energy instructional activity students analyze plots and determine solar panel use.
Curated OER
Is Grandpa Right, Were Winters Colder When He Was a Boy?
Students compare current weather data to historic data to see if there is a temperature change. In this weather lesson students complete a lab activity and determine average changes in temperature, precipitation and cloud cover.
Curated OER
Give Me a B: North Dakota Quarter Reverse
Students examine the North Dakota quarter reverse and note the bison. and Badlands displayed on it. After practicing as a group making the B sound, they explore the classrom for more words beginning with that letter. Working in pairs,...
Curated OER
Make Your Own "Weather" Map
Students create their own "weather" map using data from x-ray sources. They analyze and discuss why it is important to organize data in a fashion in which is easy to read. They compare and contrast different x-ray sources using a stellar...
Curated OER
Adventures With Maps And Globes
First graders examine the differences between a map and a globe. They discuss and identify the symbols on maps and globes, then in small groups complete a worksheet. Students then complete a Venn Diagram comparing maps and globes.
Curated OER
May We Present Planet Earth?
Students draw a map to scale. They illustrate knowledge of how to use DOGS TAILS on a map. Students identify the main parts of a map. They identify and illustrate the major features necessary for sustaining a quality of life for a society.
Curated OER
Graphing on a Coordinate Plane
Eighth graders explore the coordinate system. They identify the x and y-axis, parts of the coordinate plane, and discuss the process of plotting points. To emphasize the process of plotting points, 8th graders play an ordered pair...
Curated OER
Where In The World Is Bermuda?
Students locate the Island of Bermuda, and identify its absolute and relative location.
Curated OER
Design an Island
Students make a map of an imaginary island using the topographic symbols provided from a worksheet. Students place lakes, dwellins, reefs, etc. in areas where they would logically be located from understanding how the topography of an...
Curated OER
Getting to the Core of World and State Geography
Students create topography relief maps. In this geography skills lesson, students review geography core knowledge skills, design and make a state relief map, and compile a student atlas.
Curated OER
Where is ? ? ? ?
Students explain and explain the concept of a grid system. They define absolute and relative location and develop an imaginary city on graph paper using a grid system.
Curated OER
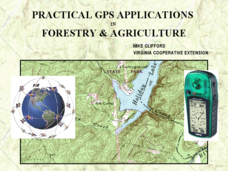
Practical GPS Applications in Forestry & Agriculture
An explanation of the Global Positioning System (GPS) and the Geographic Information System (GIS) is given in this presentation. Uses and applications are considered. How it works and sources of error are also touched upon. A large...
Curated OER
Orienteering - Lesson 4 - Distance and Height
Pretend that you've been dropped onto a mountain, in the middle of nowhere, and all you have to find your way is a topographical map and a compass. Could you find your way to the nearest town? Orienteering teaches the skills of map...
Curated OER
March of the Polar Bears: Global Change, Sea Ice, and Wildlife Migration
Students study global change and how these changes impact wildlife. In this polar bears lesson students analyze maps and data to understand climate change.
Curated OER
Creating Station Models
Students review weather conditions at various cities and create station models on a weather map.
Alabama Learning Exchange
The Sun and the Earth
Third graders study and diagram the positions of the Earth and sun during the four seasons. They predict weather for cities in the northern and southern hemispheres.


