Curated OER
What's Out There? Space Shuttle Exploration and Simulation
Students role-play the jobs of space shuttle astronauts, conduct experiments, and research space using the Internet and offline experiments. Student-astronauts hold a "press conference" to share their information with others in a...
Curated OER
Using Coordinate Geometry by Land, Sea and Outer Space.
Students complete a table of values and plot points, as well as construct a graph on a coordinate grid. They construct two graphs on the same coordinate system, and identify the point of intersection. Students represent and record...
Curated OER
Constellation Mapping
Students plot constellations on a grid map. They discuss the various ways early explorers planned their travels. Students identify and recognize major constellations. They color their maps and take them home to try to find various...
Curated OER
Coordinate Graphs
Students use coordinate graphs in order to identify objects and their locations. They are shown how to plot the x and y coordinates and then are given values to be plotted during guided and independent practice. Students are assessed on...
Curated OER
Weather Forecasts
In this weather worksheet, students view a weekly forecast for Bradford, United Kingdom and answer short answer questions about it. Students complete 7 questions.
Curated OER
Eratosthenes
Students examine what Eratosthenes is and the history behind him. In this earth instructional activity students complete a hands on activity to repeat Eratosthenes' experiment.
Curated OER
The Librarian Who Measured the Circumference of the Earth
Sixth graders explore angles, triangles, and investigate the circumference of the earth. They participate in a Webquest, access data bases, and communicate with other students through an on-line project site involving the circumference...
Curated OER
Make Your Own "Weather" Map
Students create their own "weather" map using data from x-ray sources. They analyze and discuss why it is important to organize data in a fashion in which is easy to read. They compare and contrast different x-ray sources using a stellar...
Curated OER
A Bird's Eye View of our 50 States
Third graders focus on state birds as they learned absolute location (latitude/longitude) of each state, as well as their relative location (bordering states).
Curated OER
Using My Nasa Data To Determine Volcanic Activity
Young scholars use NASA satellite data of optical depth as a tool to determine volcanic activity on Reunion Island during 2000-2001. They access the data and utilize Excel to create a graph that has optical depth as a function of time...
Curated OER
Measuring Angles
Third graders describe an amount of turn from a particular position to another using the 'circular' benchmarks of 0, ++, ++, ++, and full turn. Estimation language such as 'just about', 'between', 'not quite', 'just over', and similar...
Curated OER
Geography: Snow Cover on the Continents
Learners create maps of snow cover for each continent by conducting Internet research. After estimating the percentage of continental snow cover, they present their findings in letters, brochures or Powerpoint presentations.
Curated OER
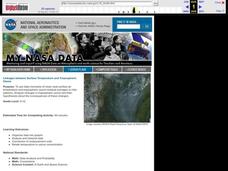
Linkages Between Surface Temperature And Tropospheric Ozone
Pupils organize and analyze data regarding changes in tropospheric ozone and then hypothesize about the consequences of these changes.
Curated OER
TE Activity: Nidy-Gridy
Students make a grid and coordinate system map of their classroom as they investigate why it is important to have a common map making system. They look at how landmarks are used for navigating an area.
Curated OER
Timing the Transit of Venus
Young scholars calculate elapsed time and look for patterns.
Curated OER
Relative Humidity of Your School
Students predict the location where the relative humidity the highest and lowest in and around their school. They use a sling psychrometer to measure the relative humidity of the various locations.
Curated OER
Is Portland, Oregon Experiencing Global Warming?
Students use data to determine if the climate in Portland has changed over the years. In this weather lesson students complete line graphs and study long wave radiation.
Curated OER
Ocean Currents and Sea Surface Temperature
Students use satellite data to explore sea surface temperature. They explore the relationship between the rotation of the Earth, the path of ocean current and air pressure centers. After studying maps of sea surface temperature and ocean...
Curated OER
Radiation Comparison Before and After 9-11
Using the NASA website, class members try to determine if changes could be detected in cloud cover, temperature, and/or radiation measurements due to the lack of contrails that resulted from the halt in air traffic after the attacks...
Curated OER
Muppet Treasure Island
Students watch the movie "Muppet Treasure Island" and then taking on roles of characters in the movie answer navigational questions to try discover the location of a treasure hidden by the teacher.
Curated OER
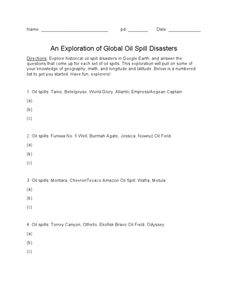
An Exploration of Global Oil Spill Disasters
In this oil spills worksheet, students write facts about the research they find about the oil spills asked. Students complete answers for 20 oil spills.
Curated OER
Sundials and Shadows - What Can They Teach Us About Seasons?
Students collect and analyze data relating to seasonal changes. They view a video, research web sites and build a sundial to collect their data.
Curated OER
Fostering Geospatial Thinking: Space to Earth: Earth to Space (SEES)
Young scholars locate and access data to help them with their science inquiry. For this geographical positioning lesson students evaluate and compare data sets.


