Curated OER
Eight Codes in Everyday Use
In this codes worksheet, students investigate eight codes used in everyday life. Fourteen activities are included as well as four miscellaneous exercise. This worksheet has great student interest.
National Council of Teachers of Mathematics
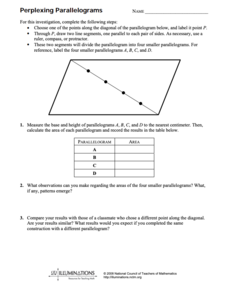
Perplexing Parallelograms
In this geometry worksheet, young mathematicians divide a parallelogram into four, by choosing points along a diagonal. Students calculate the area of each parallelogram and look for any patterns that may emerge. The one-page worksheet...
Teach Engineering
Earthquakes Living Lab: Locating Earthquakes
There are patterns in nearly everything — even earthquakes. Pairs research current earthquakes to see if there are any patterns. They determine the mean, median, and mode of the earthquake data, along with the maximum and minimum. Using...
Willow Tree
Scatterplots and Stem-and-Leaf Plots
Is there a correlation between the number of cats you own and your age? Use a scatter plot to analyze these correlation questions. Learners plot data and look for positive, negative, or no correlation, then create stem-and-leaf plots to...
Code.org
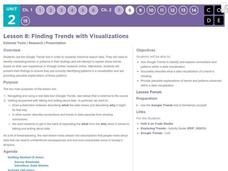
Finding Trends with Visualizations
Pupils often hear about trends, but they don't always see them. The eighth lesson plan in a unit of 15 requires individuals to use the Google Trends tool. Class members identify patterns in the visualization before presenting the...
Inside Mathematics
Snakes
Get a line on the snakes. The assessment task requires the class to determine the species of unknown snakes based upon collected data. Individuals analyze two scatter plots and determine the most likely species for five additional data...
Education Development Center
Consecutive Sums
Evaluate patterns of numbers through an engaging task. Scholars work collaboratively to determine a general rule reflecting the sum of consecutive positive integers. Multiple patterns emerge as learners explore different arrangements.
Inside Mathematics
Scatter Diagram
It is positive that how one performs on the first test relates to their performance on the second test. The three-question assessment has class members read and analyze a scatter plot of test scores. They must determine whether...
Shmoop
ELA.CCSS.ELA-Literacy.RI.9-10.4
Your pupils will be expected to determine the meaning of words and how those words affect the meaning of a text. Help them master this skill with the ideas listed here. First, look over the two activities that could be used for your...
It's About Time
How Electrons Determine Chemical Behaviors
Lead the class on an investigation as they play detective and locate patterns in the electron arrangement of atoms. During the seventh lesson, they assign valence numbers to elements, organize the periodic table in the correct sequence,...
CPM
How to Recognize the Type of Graph from a Table
Linear, quadratic, and exponential functions are represented only by their table of values in this simple, well-written worksheet. Learners decide the type of graph represented based on the differences in the function values. Included is...
Inside Mathematics
Graphs (2006)
When told to describe a line, do your pupils list its color, length, and which side is high or low? Use a worksheet that engages scholars to properly label line graphs. It then requests two applied reasoning answers.
Agile Mind
Transforming Graphs of Quadratic Functions
In the activity on this webpage, learners use interactive graphing technology to investigate transformations of graphs. In the first part of the task, they look at the graph of a quadratic function with coordinates of a few points...
Noyce Foundation
Boxes
Teach your class to think outside the box. Scholars use the concept of equality to solve a problem in the assessment task. They determine how to use a scale to identify the one box out of a set of nine boxes that is heavier than the others.
Charleston School District
Applications of the Pythagorean Theorem
Use patterns to your advantage! The Pythagorean Theorem allows learners to find missing sides of right triangles. Problems include those with both rational and irrational lengths.
Willow Tree
Approximating a Line of Best Fit
You may be able to see patterns visually, but mathematics quantifies them. Here learners find correlation in scatterplots and write equations to represent that relationship. They fit a line to the data, find two points on the line, and...
Curated OER
Spanish verb endings-regular verbs
Introduce your beginning Spanish class to regular verbs. The three-page packet contains a verb chart and three translation activities. The final page offers an extension activity which has learners search for the conjugation of irregular...
PBS
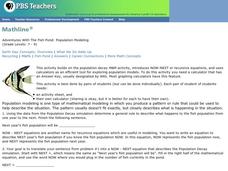
Adventures With The Fish Pond: Population Modeling
Build up from the previous activity where your learners charted the population growth and decay of a fish pond with M&Ms®. Have them look at the data from that activity and create a Now-Next, or recursive equations, to predict the...
EngageNY
Analyzing Residuals (Part 1)
Just how far off is the least squares line? Using a graphing calculator, individuals or pairs create residual plots in order to determine how well a best fit line models data. Three examples walk through the calculator procedure of...
It's About Time
Newton's Law of Universal Gravitation
While science is looking for correct explanations, pseudoscience often fills in the blanks. Pupils explore the relationship between light distance and intensity and graph their data. Then they compare their data to Newton's Law of...
Google
Surveys and Estimating Large Quantities
Looking for an estimation activity a bit more involved than the typical "guess the number of jellybeans in the jar" game? Here, learners use a picture to estimate the number of people at a large event, look for potential problems with...
Curated OER
Big, Bigger, Biggest
Which turtle is big, and which one is biggest? Add variety to your third graders' writing with a comparative adjective activity. Given eight adjectives, young writers find the comparative and superlative forms of each. The last two are...
Charleston School District
Tables of Linear Functions
Don't forget the tables! The previous lessons in this five-part series examined the linear equation and graph relationship. The current lesson adds tables to the mix. At completion, individuals should be able to create a table of values,...
It's About Time
Color
How can a hand puppet's shadow look like a dog? The lesson explains the science behind shadows, combining paint colors and the colors used in old televisions. Scholars use white, red, blue, and green lights to experiment with colors and...


