Curated OER
Piles of Paper
Track how much paper their class uses in a week. They will pile their used paper into one place, each day the pile is measured. They make predictions about how much paper they would collect in a month, then recycle the paper.
Jessica Winston
Tacky and the Winter Games
Helen Lester's wonderfully wacky, Tacky and the Winter Games, is the core text featured in a resource packet that includes a prediction exercise, an activity menu, vocabulary flash cards, and book review worksheet. A great way to cheer...
Institute of Electrical and Electronics Engineers
Insulators and Conductors
In a classic activity, emerging electricians test various objects for electrical conductivity in a circuit. Each group constructs a simple circuit by following a diagram. Predictions are made and objects are inserted into the circuit,...
Curated OER
Weather Lesson Five
Students define a weather forecast, make a forecast using a weather map, identify three prediction guidelines, and explain how computers help to make forecasts. Students make a 24-hour forecast for each of the thirteen states targeted.
Curated OER
A PLAY ON WORDS
After making predictions about Janell Cannon's story Verdi, middle schoolers read through the book and make a new list of descriptions, personality traits, etc. They select an animal and write a narrative story about the animal, paying...
Curated OER
Reading the Play
Do figures of speech enhance a play or story? In small groups, learners locate and describe figures of speech they find while reading a reader's theater play. After making predictions, they describe how the figures of speech make the...
Curated OER
Linear and Quadratic Model, Data Modeling
Students model quadratic and linear equations. In this algebra lesson, students solve word problems using equations. They create scatter plots and make predictions using correlations.
Curated OER
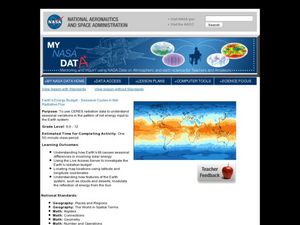
Earth's Energy Budget - Seasonal Cycles in Net Radiative Flux
Learners attempt to understand seasonal variation by viewing images of the energy received by the earth. In this weather activity, students view images from NASA of the influx of energy from the sun and make predictions about resulting...
Curated OER
Using Random Sampling to Draw Inferences
Emerging statisticians develop the ability to make inferences from sample data while also working on proportional relationships in general. Here, young learners examine samples for bias, and then use random samples to make inferences...
Curated OER
Science: Her-bariums Galore!
Young scholars collect and identify plant species and construct herbariums both at school and at home. By gathering data from both locales, they draw conclusions and make predictions about plant diversity. Upon completion of the...
EngageNY
Determining the Equation of a Line Fit to Data
What makes a good best-fit line? In the 10th part of a 16-part module, scholars learn how to analyze trend lines to choose the best fit, and to write equations for best-fit lines to make predictions.
Virginia Department of Education
Quadratic Curve of Best Fit
Class members create a table of the number of chords that can be drawn given the number of points on a circle. Pupils analyze the data created, find a function to fit to it, and use the function to make further predictions.
Curated OER
Homemade Rocks
Student make at least FIVE rocks. They write predictions about that will change and occur. Each student receives a small cup that they label with their name to hold their rocks.
Curated OER
Beans and Baleen
Predict whale populations using different beans as whales! Learners observe different types of beans in a dish knowing that each bean represents a different kind of whale. They then predict how many "whales" there are in a certain area....
UAF Geophysical Institute
Observing the Weather
How can you predict the weather without any technology? Young scientists learn to forecast the weather using traditional Native American techniques. Based on their observations of the weather, as well as talking to their classmates, they...
California Academy of Science
What Would Happen?
Nothing says classroom fun like an invertebrate and a magnifying glass! Snails, earthworms, and roly-poly bugs become the center of attention as pint-sized investigators hone their inquiry and observation skills. They are guided through...
Polar Trec
Do You See What Icy?
Here is a lesson that kicks off with a question. "How does ice floating on the ocean act as it melts?" As learners investigate this natural phenomenon, they'll discover that it has a lot to do with temperature, salinity, and the effect...
Have Fun Teaching
You Make the Call (10)
What will happen next? Young writers plot what will happen next after studying the clues in four story starters.
Curated OER
The Magical Diving Sub
First graders discuss and predict if a given object sinks or floats. They record their predictions on a data sheet. Pupils test the objects and organize them into floating/sinking groups. Students observe the floating and sinking of a...
Curated OER
Newcomers
Explore emotions associated with moving to a new home with young learners. First they listen to the books Painted Words/Spoken Memories by Aliki and Going Home by Eve Bunting. Then they are invited to share their experiences as well as...
Curated OER
Taking Its Toll
Young scholars explore ratios. For this rates lesson plan, students create a ratio to compare the price of a toll to the distance travelled. They compute the average cost per mile, determine the slope between two ordered pairs, and make...
Curated OER
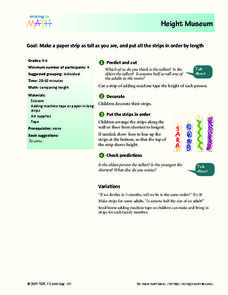
Height Museum
Here is an engaging instructional activity which invites learners to cut a strip of adding machine tape that is their height. They decorate their strip, arrange the strips from shortest to longest, and then discuss predictions.
Curated OER
Tangerine: Anticipation Guide
Encourage your readers to make predictions about Edward Bloor's young adult novel, Tangerine, with an anticipation guide that presents statements that introduce key issues in the novel.
Radford University
A Change in the Weather
Explore the power of mathematics through this two-week statistics unit. Pupils learn about several climate-related issues and complete surveys that communicate their perceptions. They graph both univariate and bivariate data and use...
Other popular searches
- Make Predictions Line Graph
- Using Data to Make Predictions
- Reading Make Predictions
- Learn to Make Predictions
- Learning to Make Predictions
- Make Predictions Science
- Make Predictions Story
- Infering to Make Predictions
- Make Predictions Reading
- Inferring to Make Predictions


