Curated OER
Main Idea in Informational Text
Readers identify main ideas and supporting details using informational texts. In this literacy lesson, they make predictions and read the text to find the main ideas. They use a table diagram to define the main idea and supporting...
Curated OER
The Berenstain Bears and Too Much Teasing
More of a worksheet than a complete lesson plan, this resource includes several pre-reading and post-reading discussion prompts for The Bernstein Bears and Too Much Teasing. The prompts on this worksheet are designed to help young...
Curated OER
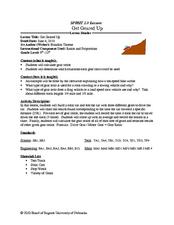
Get Geared Up
Middle schoolers calculate gear ratio as they solve word problems. They discuss and find slopes as they relate to real life. Additionally, they hey use ratio and proportion to make predictions and solve problems.
PBS
Blue Ribbon Readers: Drawing Inferences
Model for young readers how to use illustrations, chapter titles, and events in a story to draw inferences and make predictions. Learners then practice these essential comprehension strategies by drawing inferences for another section of...
CCSS Math Activities
Scatter Diagram
Don't let a great resource scatter to the winds. Pupils analyze two sets of test scores on a scatter plot. They draw a line of best fit and use it to make predictions about the test scores. They also consider any apparent trends in the...
Curated OER
Interactivate - Geometry in Tessellations
Students use an on-line worksheet to experiment with patterns of tessellations in regular polygons. As students observe different shapes in the "Tessellate" Activity they complete a data table and practice making predictions for...
Curated OER
Just Like the Old Days
Students examine customs of rural Mongolia. They read and discuss a letter, discuss families, locate Mongolia on a map, reenact scenes from the letter, and write a prediction of how life change in rural Mongolia during the next 50 years.
Curated OER
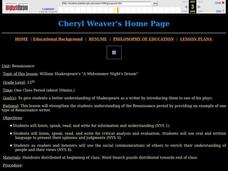
A Midsummer Night's Dream
You might not be able to put a girdle around the earth in forty minutes but you can generate interest in A Midsummer’s Night Dream in that length of time. As an introduction to Shakespeare’s comedy, pairs of students assume the roles of...
Curated OER
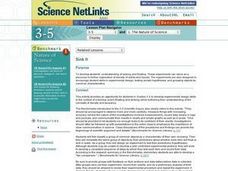
Sink It
Introduce your class to the concept of sinking and floating. In groups, they classify objects after making predictions about which materials will sink or float. They record their results and create graphs and charts to share with the class.
Curated OER
Castle in the Sky
Students research trends on housing, including predictions about environmental factors, population growth, technology, and their effects on housing in the future. They become familiar with the work of Maxfield Parrish and his use of...
Curated OER
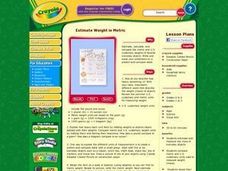
Estimate Weight In Metric
Students brainstorm words that describe the weight of objects. They pick up objects and estimate the weight. Afterward, students find the exact weight and compare U.S. units of weight to metric units. In groups, students create a chart...
Curated OER
It's About Time
First, second, and third graders explore elapsed time through estimation and prediction. They work with a partner to estimate how long it will take to perform various tasks. One person uses a stop watch to time his or her partner...
Curated OER
Planning a Scientific Investigation
This slide show provides an opportunity of you and your class to plan your own scientific investigation. Each slide contains one part of the scientific hypothesis-building process and a space to type in what the class chooses to focus...
Curated OER
Guided Reading with Ten Oni Drummers
Second graders read the book, Ten Oni Drummers. Working in guided reading groups, they discuss fantasy as a genre and preview the book. They review word identification strategies and read the book silently. After reading, they confirm...
Curated OER
Weather Predictions
Students record weather data and create a five day forecast. Students investigate the roles of meteorologists and identify symbols used on a weather map. After gathering weather data for a week, students will create a five day forecast...
Curated OER
Weather Predictions
Fourth graders explore meteorologists. They explore symbols on a weather map and make five day forecasts.
PBS
NOVA Sun Lab Lesson Plan
Looking for a sun-sational multi-lesson plan full of videos, simulations, and discussion? Introduce your young scientists to all things solar with a four-part hands-on adventure. Pupils learn the basics of solar anatomy, space weather,...
Mary Pope Osborne, Classroom Adventures Program
Dinosaurs Before Dark
Young readers travel back to the time of the dinosaurs in this literature unit based on the story Dinosaurs Before Dark. Intended for use with upper-elementary special education students, this resource provides reading comprehension,...
Penguin Books
A Teacher's Guide to the Signet Classics Edition of H.G. Wells's The Time Machine
Imagine being able to travel back and forth in time! H.G. Wells uses that scenario in his novel The Time Machine to comment on what he saw as the flaws in Victorian society and the industrial age. This teacher's guide is one of the best...
Curated OER
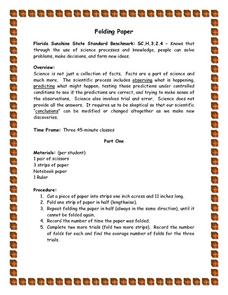
Folding Paper
Learners use the scientific process and their knowledge to obeserve, predict, and test their predictions under controlled conditions to verify their predictions and then make sense of these predictions. They also graph, write...
Curated OER
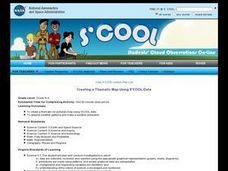
Creating a Thematic Map Using S'COOL Data
Students observe weather patterns, collect data, and make a weather predictions for various locations on a map.
Curated OER
Geometry- Hands and Feet
Students identify units of measurement. In this measurement lesson, students predict the length and width of their hands and feet. Students discuss their findings and if their predictions were correct.
Curated OER
Guided Reading: Desert Life
First graders read a book with the teacher while encountering unfamiliar words and learning how to use context clues and visual clues to understand the material. For this reading comprehension lesson, 1st graders make predictions and...
Curated OER
Coin Count & Classification
Students make a prediction about how 100 pennies sort by decade or year and then test their predictions. They organize their data using a graph that is imbedded in this lesson.
Other popular searches
- Make Predictions Line Graph
- Using Data to Make Predictions
- Reading Make Predictions
- Learn to Make Predictions
- Learning to Make Predictions
- Make Predictions Science
- Make Predictions Story
- Infering to Make Predictions
- Make Predictions Reading
- Inferring to Make Predictions


