Curated OER
Thank You... Thomas Edison!
Pupils investigate the life of Thomas Edison. They research how he made a difference. They understand that accurate data collection is important for math. They create a chart using spreadsheet data.
Curated OER
Glow With the Flow
Students investigate the force of drag and how NASA engineers use models and glowing paints to examine how air flows over vehicles in a wind tunnel. They discover how the blended wing body will affect air travelers of the future.
Curated OER
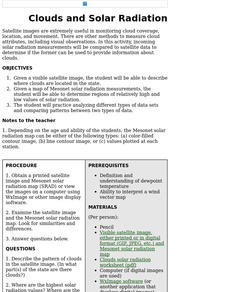
Clouds and Solar Radiation
Students examine how clouds affect incoming solar radiation. They compare and contrast satellite images and incoming solar radiation measurements as methods to provide information about clouds.
Curated OER
Science: Hurricanes As Heat Engines
Students conduct Internet research to track the path of Hurricane Rita. They record the sea surface temperature of the Gulf of Mexico during and after the hurricane and draw conclusions about how hurricanes extract heat energy from the...
Texas Education Agency
Texas Gateway: Collecting Data and Making Predictions
Given an experimental situation, the student will write linear functions that provide a reasonable fit to data to estimate the solutions and make predictions.
PBS
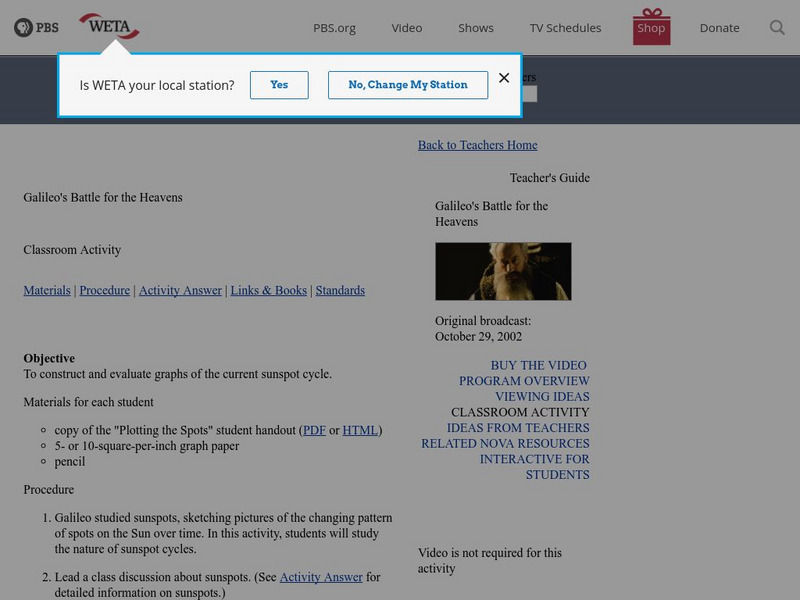
Pbs Teachers: Galileo's Battle for the Heavens Plotting Sun Spots
In this activity, students follow in Galileo's footsteps as they examine the nature of sunspot cycles, define solar minimum and solar maximum, and graph data for a solar cycle. Then they will predict the next solar maximum and when the...
PBS
Pbs Mathline: Fill 'Er Up Lesson Plan [Pdf]
Young scholars will pour liquids into different sized containers to test their predictions as to the amount each will hold. Printable lesson plan.
Brown University
Linear Interpolation
This site explains how linear interpolation allows for prediction and gives several examples.
Alabama Learning Exchange
Alex: Relationship Between Height and Length
In this lesson, eighth grade students will collect data. They will use this data to analyze the relationship between the height of an individual and the length of his/her foot. Students will use a line of fit to make predictions for...
Rice University
Rice University: The Hand Squeeze
Students will enjoy this data collection and class analysis experiment involving the time it takes for a hand squeeze to travel around a circle of people. From organizing the activity to collecting the data to making a table and graphing...
Texas Instruments
Texas Instruments: Boat Registration and Manatee Deaths in Florida
Students will explore the data on boat registrations and manatee deaths in Florida. They will use the data, the graph of the data and the line of best fit to make predictions about the relationship of the data.
Other
University of Wisconsin Green Bay: Faults and Earthquakes
This site is primarily set up as an outline and is loaded with graphs, maps, and images. It covers a variety of earthquake-related topics, such as what causes earthquakes, fault lines and structures, seismology, a historical look at...
Other
Stat Soft: Statistics Glossary
Dozens of statistical terms are defined and illustrated in this glossary.


![Pbs Mathline: Fill 'Er Up Lesson Plan [Pdf] Lesson Plan Pbs Mathline: Fill 'Er Up Lesson Plan [Pdf] Lesson Plan](https://d15y2dacu3jp90.cloudfront.net/images/attachment_defaults/resource/large/FPO-knovation.png)


