Curated OER
Shaquille O'Neal Hand/Foot Span
Shaquille O'Neal has huge hands and feet, and learners will use those two measurements to practice collecting and extrapolating data using ratios. They record the measurement of foot and hand span of several of their classmates, then...
Yummy Math
Valentine’s Day = Roses
Roses are red, but did you know that some are lighter while others are darker? Scholars read an infographic to decipher the fraction and percent of rose color and their country of origin. They go on to make comparisons and estimate while...
Curated OER
Comparison of Economic Systems
Here is a worksheet in which learners identify and compare economic systems (market, command, mixed, etc.) with 18 fill-in-the-blank questions and a graphic organizer.
Curated OER
Welcome to Top Score: Verdi's 'Don Carlos'
High schoolers study the elements in the production of an opera including the personalities, ideas, and stage presence. They examine the skills that are necessary to be a performer in an opera in this series of lessons including making...
Radford University
Sleep and Teen Obesity: Is there a Correlation?
Does the number of calories you eat affect the total time you sleep? Young mathematicians tackle this question by collecting their own data and making comparisons between others in the class through building scatter plots and regression...
Pingry School
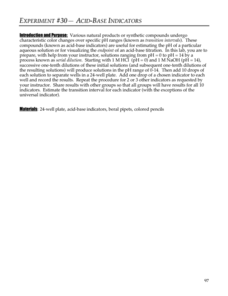
Acid-Base Indicators
Acid-base indicators are an essential part of any chemistry classroom. Individuals explore the color-changing feature of the important indicators in a vibrant hands-on activity. Using serial dilution, learners create solutions ranging...
National Wildlife Federation
Wind Power
Many have played with seed helicopters at one time or another. Learners use paper to create their own helicopters to model the Linden seed. After a discussion of seed dispersal, they take their models outside, let them go, and make...
Illustrative Mathematics
Which Weighs More? Which Weighs Less?
Expand the the comparative language of young mathematicians with a hand-on weight measurement activity. Working independently or in pairs, children compare the weight of large wooden blocks to various other classroom objects, recording...
Willow Tree
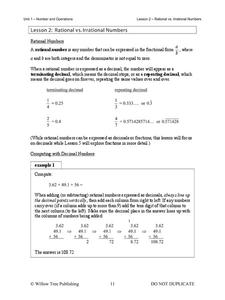
Rational vs. Irrational Numbers
Build an understanding of rational numbers and their counterpart irrational numbers. Lead learners through an explanation of rational numbers and the ways they can be expressed. Then introduce them to irrational numbers and make...
EngageNY
Graphing Cubic, Square Root, and Cube Root Functions
Is there a relationship between powers and roots? Here is a activity that asks individuals to examine the graphical relationship. Pupils create a table of values and then graph a square root and quadratic equation. They repeat the...
EngageNY
Conversion Between Celsius and Fahrenheit
Develop a formula based upon numerical computations. The 31st part of a 33-part unit has the class determine the formula to convert a temperature in Celsius to a temperature in Fahrenheit. They do this by making comparisons between the...
CK-12 Foundation
Stratified Random Sampling: An Extracurricular Study
Learning isn't a random process. A well-designed interactive lesson helps classes make key conclusions about stratified random sampling. They calculate group percentages and use those percentages to decide on sampling totals.
Concord Consortium
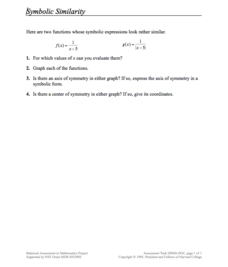
Symbolic Similarity
How many things does one transformation tell you? Learners compare and contrast the graphs of different parent functions with the same transformation. Using a rational and absolute value function, pupils identify key features of their...
NOAA
The Incredible Carbon Journey: Play the Carbon Journey Game
Class members explore the carbon cycle in the final installment of the 10-part Discover Your Changing World series. They play a simulation game where they walk through the steps carbon takes as it cycles through the different layers of...
NASA
Earth’s Energy Budget - Seasonal Cycles
Earth's energy budget should be in the red. Young researchers review satellite data in a presentation to study Earth's solar radiation. They make both qualitative and quantitative observations about variations in available seasonal...
Curated OER
Making History....Literary
Connect the Common Core ELA standards with history by employing a balanced literacy approach to reading.
Curated OER
Chalk and Cheese
Students make comparisons and identify opposites. Through discussion and word identification, students working independently or in pairs, compare and contrast things that are usually thought of as opposites. They practice English...
Curated OER
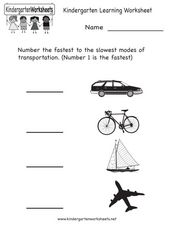
Modes of Transportation
In this making comparisons instructional activity, students examine the pictures of a car, a bicycle, a sailboat, and an airplane. Students rank the 4 modes of transportation according the how quickly the travel.
Curated OER
Fall Leaves Fall! Lesson Plan
Students discover facts about leaves. In this early childhood lesson plan, students identify different types of leaves, and make predictions about which types of leaves they think they will find in their community. Students collect...
Curated OER
Breathing Rates and Exercise
Learners work in groups to predict which condition produces more breaths per minute. Groups record their breathing rates during rest periods and periods of activity. They graph their results and make comparisons to their predictions.
Pacific Science Center
Worlds in Comparison
Young astronomers follow a step-by-step procedure for dividing a lump of dough into parts, resulting in a scaled volume set of puny planets. Along with the printable directions is a template chart of planet names on which learners can...
Curated OER
Make Them the Same- Drawing Comparisons- Dog and Squirrel
In this drawing worksheet, students examine the first picture in each box and draw the missing details in the second picture in each box. They compare the pictures of a dog in the first set, and the pictures of a squirrel in the second set.
Curated OER
Little Pig, Little Pig
First graders compare versions of the Three Little Pigs. In this comparison lesson, 1st graders read several version of the Three Little Pigs and compare the situations, characters, settings, solutions, emotions and costumes. Students...
Curated OER
Our World With MapsQ
Learners examine and compare different types of maps. In this map skill lesson, students look at neighborhood and national maps on the overhead projector while making comparisons of the symbols and locations. They use a T-chart to record...


