Curated OER
Multiplying Inequalities by Negative
Students multiply inequalities by negative. In this algebra lesson, students solve inequalities and graph their solutions on a number line. They pay close attention to the negative consequence, which causes the sign to flip.
Curated OER
Angle-Side Relationships
Learners investigate triangles and their angle-side relationship. In this geometry lesson plan, students identify the property of the triangles and use it to solve the problem correctly. They use the TI to graph their triangles.
Curated OER
Logarithmic Transformations of Data
Students investigate and study logarithmic equations. In this precalculus lesson, students analyze the data behind the function. They define each graph as positive, negative or no correlation. They find the line of best fit.
Curated OER
How Far is Far?
Students calculate the standard deviation of data. In this statistics lesson, students collect data, plot it and analyze it. They identify the mean, median and range of their data.
Curated OER
Normal Probability Plot
Students analyze the graph of a distribution. In this statistics instructional activity, students define skewed or mound shape distribution as they investigate the data behind the graph. They define and plot outlier as well as normal...
Curated OER
Looking Normal
Students identify the shape of a function. In this statistics lesson, students plot the data collected. They analyze their data for positive, negative or no correlation. They find the line of best fit.
Curated OER
Particle Motion1
Students analyze piecewise functions. In this precalculus lesson, students identify the position, velocity and distance. They analyze the relationship between the graph, its position and velocity.
Curated OER
Particle Motion 2
Students analyze the motion of a particle along a straight line. In this precalculus lesson, students use the TI to analyze the position of a function as they graph and visualise the function. They calculate the distance and velosity of...
Curated OER
Center of Mass
Students identify the geometric mean of their data. In this statistics lesson plan, students collect data and graph their findings. They identify the mean, range and mode.
Curated OER
Drawing a Triangle with Cabri Junior
Learners draw triangles on their graphing calculators using the Cabri Junior application. In this graphing calculator lesson, students follow step by step directions to create triangles on their calculator. They identify the type of...
Curated OER
Not So Snappy 10
In this order of operations (i.e., addition, subtraction, multiplication, division) worksheet, students solve 3 word problems demonstrating their understanding of the concept.
Curated OER
How Does a Spring Scale Work?
Students create visuals of the effect of a spring scale. In this algebra lesson plan, students use the navigator to graph the effects created by a spring scale. They draw conclusion from the graph.
Curated OER
Systems of Equations
Students solve problems using systems of equations. In this algebra instructional activity, students find the point of intersection of two lines. They use the TI Calculator to graph and see the point of intersection.
Curated OER
Slope and Tangent
Students differentiate between the slope and the tangent of the horizontal. In this precalculus lesson, students examine slopes created by tangent lines. They observe the angle formed using properties of the unit circle.
Curated OER
Center and Spread
Students collect and analyze data. In this statistics lesson, students define and calculate the range, median and standard deviation. They identify reasons for a skewed distribution.
Curated OER
Assessing Normalcy
Students define normal distribution as it relates to the bell curve. In this statistics lesson, students use the central tendencies of mean, median and mode to solve problems. They plot their data and draw conclusion from the graphs.
Curated OER
Meaning of Power
Pupils graph exponential and power functions. In this statistics instructional activity, students test a specific hypotheses and draw conclusion. They use the graph of polynomials to test and draw their conclusions.
Curated OER
MVT for Integrals
Students identify the meaning of the Mean Value Theorem. In this calculus activity, students solve problems using the definite integral. They calculate the average value of a function.
Curated OER
Visualizing Solids of Revolution - Washers
Students solve the area of a cross section. In this calculus lesson, students solve areas rotated and bounded by two functions. They solve using the washer method.
Curated OER
Z-Scores
Students solve problems by identifying the percent of area under the curve. In this statistics lesson, students discuss z-scores as they calculate the different percentages under the bell curve. They calculate the standard deviation.
Curated OER
What is a P-value?
Students test the hypotheses using p values. In this statistics lesson, students define and examine conditional probability. They test each statement for a true statement or a false statement, based on the sample size.
Curated OER
Fraction Word Problems
In this fraction worksheet, students solve a set of 8 word problems, all using fractions. A website reference is given for additional activities.
Curated OER
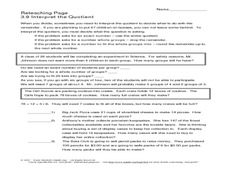
Interpreting the Quotient
In this interpreting the quotient worksheet, 6th graders read examples of division problems to decide what to do with the remainders, then answer 3 questions.
Curated OER
Using a Chart or Table
In this charts and tables worksheet, students follow directions on setting up charts or tables to help them solve time and addition word problems. Students complete 3 problems.


