Curated OER
Energy Content of Foods
Learners collect data, organize and analyze the data and compare it to real life scenarios. This assignment requires two class periods.
Curated OER
Does Clear Water mean Healthy Water?
Learners test their local aquatic site to determine its water clarity. They collect a water sample and measure its turbidity using a sensor, then they repeat the experiment to obtain a second turbidity reading to find the average value.
Texas Instruments
Light and Day
Pupils explore the concept of collecting data as they collect data on their graphing calculator about time, temperature, and light. Learners plot the data and create histograms and box and whisker plots to analyze the data.
Curated OER
When the Snow is as High as an Elephant
High schoolers study the concept of mean values using a data plot. Learners enter the given data in the activity to create their data table. They use the data table to calculate the mean of the snowfall percentage provided in the...
Curated OER
Angling for Distance
Explore the concept of projectile distance through determining the angle that will provide the maximum distance of a launched projectile. Students launch baseballs on a football field and video tape the path of the ball.
Curated OER
Graphing the Absolute Vaule Function
Learners investigate the graph of the absolute value function and the relationship between the parameters of the equation and the graph of the function.
Curated OER
Augmented Matrices
Pupils write systems of equations in an augmented matrix and enter it into their calculator. They use the reduced row echelon function on the calculator to solve the system of equations.
Curated OER
Chill Out: How Hot Objects Cool
Teach how to explore exponential equations. In this Algebra II lesson, learners investigate the graph that occurs as a hot liquid cools. Students model the data algebraically.
Curated OER
Curve Fitting
Pupils investigate linear, quadratic, and exponential regressions. They plot sets of data points, determine the regression equation that best fits the data and lastly investigate the coefficient of determination.
Curated OER
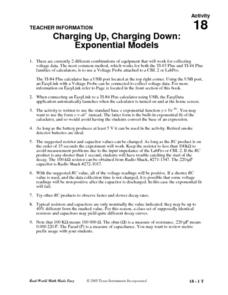
Charging Up, Charging Down
Learners collect and analyze voltage data. Then, they investigate exponential functions using the TI and a Voltage Probe and graph their data and analyze it using a table.
Texas Instruments
Graphing Calculator Investigation Graphs of Relations
Learners investigate relations in this algebra lesson plan. They graph the set of ordered pairs that determine a relation. Using a TI-83 Plus, your learners will enter the coordinates in a list, create a scatter plot, and manipulate the...
Curated OER
Rational Numbers
Young scholars investigate rational numbers in this algebra lesson plan. They graph systems of equations and use technology to find the point of intersection. They need a TI for this assignment.
Curated OER
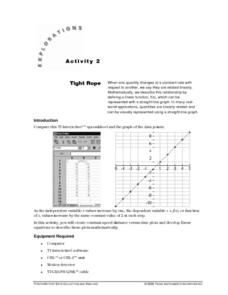
Tight Rope
Learn how to explore the concept of linear functions. In this linear functions lesson, students collect linear data from a motion detector. Students walk to create a linear function. Students plot the points on a graph and determine a...
Curated OER
NUMB3RS Activity: Settling The Score
Learn how to investigate matrix multiplication. In this secondary mathematics lesson, students examine matrix multiplication in the context of a Homes-Rahe stress test which is similar to the process used to score figure skaters. The...
Curated OER
NUMB3RS - Season 3 - "Provenance" - Set the Trap
Learners investigate concept of matrices through iteration in this probability instructional activity. They investigate probability by creating a instructional activity based on a famous painting. This assignment contains extensions to...
Curated OER
Quadratic Function Investigations
Learners perform investigation of quadratic functions while taking part in the solving of various types of problems. They explore the changes in the coefficients on the quadratic function to observe the patterns. The lesson plan includes...
Curated OER
Graphing Rational Functions
Learners complete an activity, included, of the information on asymptotes and intercepts. They also solve and complete eight questions on graphing rational functions, file included. Finally, pupils summarize vertical asymptotes,...
Curated OER
NJ HSPA Cluster 4
Pupils engage in a lesson that is focused upon helping them to complete exercises used to prepare for the High School Proficiency Assessment. They look at the patterns seen in algebraic problems and focus upon the cluster areas of...
Curated OER
Complex Numbers
Students examine complex numbers. In this Algebra II lesson, students investigate two programs that involve complex numbers: the MANDELER Program and SYNDIV program.
Curated OER
Equations for Curves Passing through a Given Set of Points
Learner use three random locations on the coordinate system and simplify the expression and assign result to the variable loc. They substitute guesses for the center and radius of the circle in the equation for the center of a circle and...
Curated OER
Domian and Range of Graphs
High schoolers determine the domain and range of various graphs using a graphing calculator. Given a set of graphs to analyze, learners calculate the range and domain of the graphs by plotting the graphs on their calculators. Downloads...
Texas Instruments
2B or not 2B a Functions
Learners use their graphing calculators to view graphs of equations. They tell if each equations is or is not a function and are shown pre-set graphs on their graphing calculators. They use the Quick Poll feature to indicate if the graph...
Curated OER
Show Me the Money
Pupils investigate financial applications of mathematics in this mathematics lesson. They will investigate equations that represent a company’s income, expense, and profit functions and use those equations to identify break even points...
Curated OER
Logistic Growth
Through the exploration of population growth of a bacteria population, high schoolers learn about and observe bacteria population over a 20 hour period. Students graph the population growth using a scatter plot and discuss its logistic...


