Curated OER
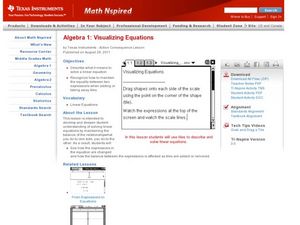
Visualiziing Equations
Students use visuals and words to solve equations. In this algebra lesson, students observe the necessary steps needed to add, subtract,multiply and divide to solve an equation. They graph their solution using the TI calculator.
Curated OER
Graphing Linear Equations
Students graph linear equations. In this algebra lesson, students perform transformation on linear equations. They identify the slope and y-intercept of each line.
Curated OER
What is a Solution to a System?
Pupils define the solution to a system of equation. In this algebra lesson, students graph two line on the TI calculator and identify the point of intersection if there is any. They find one, zero or infinitely many solution and explain...
Curated OER
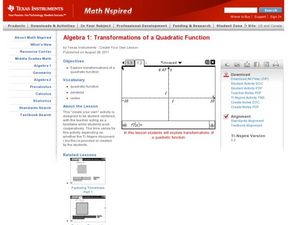
Transformations of a Quadratic Function
Learners graph quadratic functions. In this algebra lesson plan, students perform transformation on the TI calculator as they create a visual. They identify the vertex and intercepts of the parabola.
Curated OER
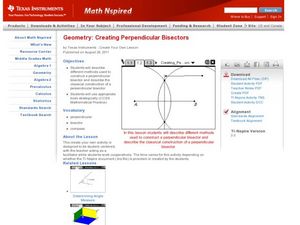
Creating Perpendicular Bisectors
Students create perpendicular bisectors. In this geometry lesson plan,students use a straight edge and protractor to create a perpendicular bisector. They graph line on the TI and analyze it.
Curated OER
The Function Elevator
Students solve and graph functions. In this precalculus lesson plan, students use piecewise function to relate real life scenarios. They analyze the graphs and identify the vertex and intercepts.
Curated OER
Products of Linear Functions
Students investigate the horizontal intercepts of functions. In this algebra lesson, students identify whether the factor of two functions results in a quadratic equation or not. They compare and contrast linear equations and higher...
Curated OER
Simple Harmonic Motion
Students solve problems involving graphs. In this calculus lesson, students relate harmonic motion to velocity. They discuss the derivative and the effect on the functions created.
Curated OER
Transformations: Dilating Functions
Young scholars dilate functions using transformation. For this algebra lesson, students complete vertical dilation, stretch and shrink. They perform reflection across the x and y axis.
Curated OER
Position and Piecewise Velocity
Students solve piecewise functions. In this precalculus lesson, students model real life scenarios using velocity and piecewise. They create velocity graphs and find the beginning and end position of an object.
Curated OER
Perfect Shuffles
Students investigate piecewise functions. In this algebra lesson, students model piecewise functions in the real world. They graph the parts of the functions following the restrictions of the domain.
Curated OER
Dynagraphs
Students collect and graph their data. In this precalculus lesson, students identify the input and out of a function. They find the domain and range and the inverse of a function.
Curated OER
End Behavior of Polynomial Functions
Students identify the end behavior of polynomial functions. In this algebra lesson, students graph different polynomials functions and find a correlation between exponents and function behavior. They identify the effect the leading...
Curated OER
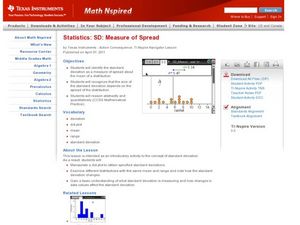
Measure of Spread
Students identify the standard deviation. In this statistics lesson, students find the mean distribution and calculate the percent of deviation from the mean. They observe this change on the Ti calculator.
Curated OER
Confidence Levels
Learners collect data and graph it. In this statistics lesson, students rate confidence levels by collecting data and analyzing it. They graph their findings on the Ti calculator.
Curated OER
EE*Pro App
Scholars investigate EE*Pro App. In this secondary mathematics lesson, let your class explore an all-inclusive App for electrical engineering students. The App is organized into analysis, equations, and references.
Curated OER
ME*Pro App
For this secondary mathematics lesson, learners investigate the uses and capabilities of a TI-89 application designed for mechanical engineering learners. The app contains over 700 pieces of reference information and organized into...
Curated OER
More of U.S.
Explore graphical representation of a real-life data set and determine the exponential regression model for the data in your classroom. Learners also compare the estimated value to the given value by determining the percent error.
Curated OER
Graph Polynomial Functions
Pupils explore a method of checking the sum or difference of polynomials by graphing the problem and the simplified answer and comparing the graphs.
Curated OER
The Standard Form of A Quadratic Equation
Students investigate equations that are in the standard form of a quadratic equation represented as Y=ax2+bx+c. They factor the equations into linear factors to determine the x intercepts. The graph is also used to determine the x...
Curated OER
NUMB3RS Activity: Financial Futures
High schoolers discuss the calculated risk example in Numb3rs about a businesswoman from a company that made its money trading in futures. They use a formula given by the teacher to compute the estimated value of an investment after...
Curated OER
Solving Trigonometric Equations
Pupils will investigate trigonometric equations. In this trigonometry instructional activity, they explore solving equations using a TI-83 calculator and solve trigonometric equations by graphing each side of the equation as a function...
Texas Instruments
Serious Series
High schoolers are introduced to infinite series, geometric and telescoping series as well as the relationship between the sequence of partial sums of a series and its sum. They apply symbolic capacity of their calculator and calculus to...
Curated OER
Drawing Regular Polygons
Learners investigate properties of regular polygons. In this geometry instructional activity, your class will use a graphing calculator and parametric equations to construct regular polygons and investigate the relationship between the...


