Curated OER
Scatter Plots
Seventh graders investigate how to make and set up a scatter plot. In this statistics lesson, 7th graders collect data and plot it. They analyze their data and discuss their results.
Curated OER
Explore Your Natural Habitat
Students identify habitats and understand why they are important to our environment. In this environmental lesson students design their own habitat, observe and record data on the impact their habitat has on the environment.
Curated OER
Shake It Up
Learners explore the three types of mixtures through the use of interactive video. They experiment making mixtures using a variety of ingredients, while observing, comparing and contrasting, and identifying the types of mixtures.
Curated OER
Shop 'Til You Drop
Students compare food prices to find the lowest unit price and make choices about where to shop and what to purchase on weekly items, cost comparisons and items needed. They collect grocery ads and weekly sale flyer's to expedite their...
Curated OER
TI-Nspire Activity: What Does Your Representation Tell You?
By learning to select the best representation for three meal plans, students compare three meal plans to determine the best choice. Data for the meal plans is sorted on a table, as an algebraic equation, and graphed on a coordinate grid....
Curated OER
Chemistry Lab: Chemical Equilibrium
Students investigate the effects of adding or removing a reactant or a product on chemical equilibrium. In this equilibrium lesson plan, students add or remove ions to solutions to determine the effects on equilibrium. They make...
Curated OER
How Do You Know A Panther Was Here?
Students research the signs that panthers leave. In this panther track activity, students conduct Internet research into the signs that panthers leave such as tracks, scat, scrapes, and scratches. They make a three-dimensional poster...
Curated OER
The Motivation for Movement
Young scholars explore the geographic theme of movement. In this migration lesson, students discuss push-pull factors that motivate immigrants and interpret illegal immigration data. Young scholars also discuss the difficulties that...
Curated OER
Cardiovascular Disease and Fitness: Exploring the Rhythm of Your Pulse
Students explore several examples of cardiovascular diseases. In this anatomy lesson, students explain why physical fitness is very important. They count their pulse rate and record them on a data table.
Curated OER
A Clasroom Study of the Life of an Airplane
Students participate in an experiment to discover the properties of lift. They work together to complete calculations and collect data. They share their results with the class.
Curated OER
Angles Formed By Parallel Lines
Young scholars explore the concept of angles formed by parallel lines.They graph two parallel lines cut by a transversal, then measure the angles formed by the transversal and record the data in a table. Learners make conjectures about...
Curated OER
Concept: What's The Chance?
In this concept worksheet, students perform probability experiments. Using collected information, they interpret the data. Students answer questions about probability. This five-page worksheet contains approximately 15 multi-step...
Curated OER
1928 Flu
Students state the some diseases are the result of infection. They describe the risks associated with biological hazards, such as viruses. Pupils name ways that infectious disease can be prevented, controlled, or cured. Students...
Curated OER
Comparing Densities of Different Liquids
Students experiment with a variety of liquids to calculate density. For this integrated science and math lesson, students listen to a story in which the characters must prove and explain why 5 "mystery" liquids react in a certain manner....
Center for Innovation
Air Pollution: What's the Solution?
In this air pollution worksheet, students collect data for their county of residence as well as 10 surrounding counties including the total population and the county grade for the air. They use a map of their state and identify the 10...
Curated OER
What is the Relationship Between Radioactivity and Radon?
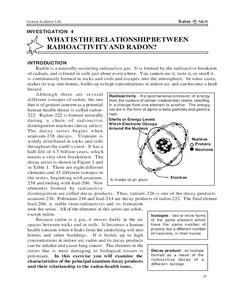
In this radon and radioactivity worksheet, young scholars analyze the data of the isotopes of elements that occur in the decay series of uranium-238. Students answer 6 questions about the isotopes, their half-lives, their potential...
Curated OER
Water, Water Everywhere
Learners explore water. In this water absorbency instructional activity, students experiment with different items to see if they absorb water. Learners record their findings on a data sheet. Students then try making music with drinking...
Curated OER
Green Food Graph
Students explore graph making by investigating St. Patrick's day food. In this holiday food lesson, students discuss their favorite green foods in honor of St. Patrick's day. Students create a graph based on the data of which green foods...
Curated OER
Household Acids and Bases
Ninth graders complete an experiment to determine the pH values of a variety of common household substances. They use red cabbage to find the indicator colors of the pH range. They complete a data table that includes a prediction and...
Curated OER
Piecewise Modeling with Multiple Functions: Federal Debt
Students analyze data on debt and write an equation. In this statistics lesson, students are given data from different time periods, and are asked to graph and analyze the data. They work in groups, and are assigned different parts of...
Curated OER
Lesson 3 Activity 1: On the Trail of Knowledge
High schoolers plot the earthquake epicenter data on the base map of the North Atlantic ocean floor using different symbols or colors to characterize different values.
California Academy of Science
Measuring Earthquakes
After a brief discussion on earthquakes, make a makeshift seismograph to record the shaking of the table that it sits upon. While the background information will be useful to you as a teacher, the seismograph does not seem like it would...
Curated OER
Community Wellness Fair
Twelfth graders list ideas to create a wellness fair. They form student committees to organize times for each class to participate in the fair. Students assist in setting up the fair by putting up tables for the exhibitors, preparing...
Curated OER
Shopping Around
Third graders select a recipe and compare prices for ingredients at two different stores. They select the best place to buy the ingredients and answer questions about the process. They include their data on a spreadsheet related to their...


