Curated OER
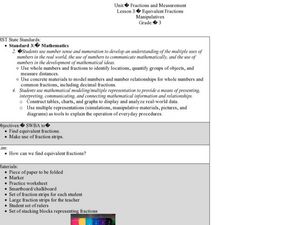
Equivalent Fractions Manipulatives
Students study fractions. In this equivalent fractions lesson, students utilize fraction strips to enhance their understanding of equivalent fractions. They watch a demonstration and then work independently with their own set of fraction...
Curated OER
Analyzing Political Cartoons
Seventh graders identify a political cartoon and analyze a pre-Revolutionary War political cartoon. In this political cartoon lesson, 7th graders discuss cartoons and the historical beginnings of American politics using a PowerPoint...
Curated OER
Environmental Graphing
Young scholars experiment with graphing. In this graphing introduction lesson plan, students complete four activities: 1) a bar graph based on class birthdays 2) an estimation graph of the raisins in raisin bread 3) another estimation...
Curated OER
Hey, Look Me Over!
Students make observations about mealworms using hand lenses, rulers, and cotton swabs. Students complete their own mealworm observation chart, then they share their observations with the class. This is one station out of five in an...
Laboratory for Atmospheric and Space Physics
Growing Up With A Mission
New Horizons began its journey to Pluto in 2006. Ten years later, it continues its mission. In that time, scholars have surely grown, but how much more will they grow by the time New Horizons reaches its destination? Find out with an...
PHET
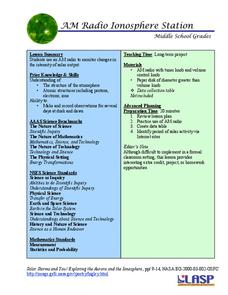
AM Radio Ionosphere Station
Tune in! Young scientists use an AM radio at home to monitor solar output. The long-term project would be ideal in a flipped classroom or as an out-of-class project.
Polar Trec
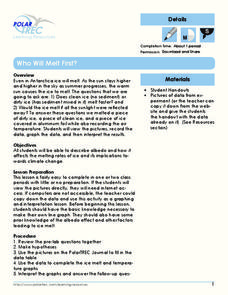
Who Will Melt First?
If the Greenland ice sheet melted, sea levels would rise by about 20 ft; if the Antarctic ice sheet melted, sea levels would rise by 200 ft. Scholars explore ice melting through the analysis of different ice samples, clean and dirty ice....
Virginia Department of Education
Road Trip
Help plan a road trip with linear equations. Scholars consider two different rental car companies and write equations representing the cost for each company. They graph the system of equations to determine the conditions under which each...
NOAA
Mapping the Deep-Ocean Floor
How do you create a map of the ocean floor without getting wet? Middle school oceanographers discover the process of bathymetric mapping in the third installment in a five-part series of lessons designed for seventh and eighth graders....
Minnesota Literacy Council
Scientific Method
Here is a resource with a descriptive approach to explaining the scientific method. It's simple, but effective for both introduction and reinforcement of this concept.
EngageNY
Scatter Plots
Scholars learn to create scatter plots and investigate any relationships that exists between the variables with a lesson that also show them that statistical relationships do not necessarily indicate a cause-and-effect relationship.
Illustrative Mathematics
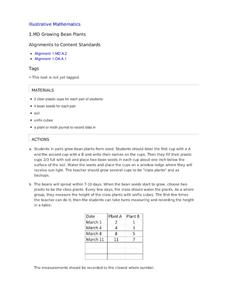
Growing Bean Plants
Plant growth experiments offer rich, cross-curricular learning opportunities that can really excite and engage young learners. In this series, children work in pairs planting, measuring, and comparing the height of bean plants in order...
Teach Engineering
Maximum Power Point
Investigate the maximum power output of a photovoltaic panel with a lesson that introduces the class to the maximum power point. Individuals learn how to determine the maximum power point of a solar panel by using Ohm's law and the power...
Virginia Department of Education
How Much is that Tune?
Tune in for savings! Scholars investigate pricing schemes for two different online music download sites. After comparing the two, they determine the numbers of songs for which each site would be cheaper.
NASA
Development of a Model: Analyzing Elemental Abundance
How do scientists identify which elements originate from meteorites? Scholars learn about a sample of material found in a remote location, analyzing the sample to determine if it might be from Earth or not. They study elements, isotopes,...
Council for Economic Education
A Penny Saved
A penny saved is a penny earned! Scholars research the different ways to save money over a lifetime. They investigate the Rule of 72, compound interest, and sub-prime loans to gain an understanding of how banks aid in the saving process....
Nuffield Foundation
Effect of Size on Uptake by Diffusion
Cell size is limited by the surface area to volume ratio, but why is this true? Scholars measure the surface area and volume of cubes before placing them into liquid. After a set amount of time, they measure the uptake by diffusion for...
American Statistical Association
Spinners at the School Carnival (Unequal Sections)
Everyone's a winner. Scholars analyze a spinner with five unequal sections, three of which represent winning a toy car and the other two represent winning a toy truck. They conduct an experiment to estimate the number of toy cars and...
EngageNY
Secant Angle Theorem, Exterior Case
It doesn't matter whether secant lines intersect inside or outside the circle, right? Scholars extend concepts from the previous lesson to investigate angles created by secant lines that intersect at a point exterior to the circle....
NOAA
Ocean Acidification
If tap water is more acidic than ocean water, why are we so concerned about ocean acidification? The third installment of a 23-part NOAA Enrichment in Marine sciences and Oceanography (NEMO) program focuses on carbon dioxide levels in...
Polar Trec
Plankton Parents
Plankton are so abundant in the ocean they outweigh all of the animals in the sea. In this three day activity, groups discuss and become familiar with plankton, capture females, and look for egg production on day three.
Curated OER
Graphs Galore
Fourth graders conduct surveys to collect data. They analyze and interpret the data, then determine which type of graph is appropriate for the data. Students use the data to make predictions, discover patterns and draw conclusions...
Curated OER
Comparison of Snow Cover on Different Continents
Students use the Live Access Server (LAS) to form maps and a numerical text file of snow cover for each continent on a particular date. They analyze the data for each map and corresponding text file to determine an estimate of snow cover...
Curated OER
Rocketsmania And Slope
Students use a professional basketball team's data and graph it on a coordinate plane. They draw a line of regression and finding its equation. They access a website containing statistics for the Houston Rockets basketball team to solve...


