Virginia Tech
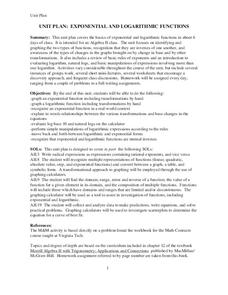
Unit Plan: Exponential and Logarithmic Functions
A six-day unit for algebra II on exponential and logarithmic functions builds upon Chapter 12 of Merrill Algebra II with Trigonometry; Applications and Connections. The text provides assistance in the depth of instruction and homework...
Curated OER
Collect, organize and compare different data for the Marine Mammals of the Miami Seaquarium, i.e.: size, weight, diet and habitat and how to calculate average, median, mode and range.
Students collect, organize, and compare different data and develop statistical methods such as: average, median, mode and range as a way for decision making by constructing table
Curated OER
Designing Models to Simulate Actual Events Using a Table of Random Digits
Learners design models to simulate actual events using a tale of random digits. They estimate the likelihood of a particular outcome using results of simulation. Students investigate the uses of statistical methods to analyze data.
Curated OER
Graphing Data
Second graders examine how to make and read bar graphs. In this bar graph lesson, 2nd graders compare bar graphs to pictographs by looking at hair color survey data. They practice making a bar graph and finding the range of the data.
Curated OER
Collecting, organizing and comparing data for cellular telephone buying and calculating average, and median price and best deal per cost.
Pupils research data and develop statistical methods such as mean and median price and make convincing arguments as powerful ways for decision making.
Curated OER
Make Your Own "Weather" Map
High schoolers create their own "weather" map using data from x-ray sources. They analyze and discuss why it is important to organize data in a fashion in which is easy to read. They compare and contrast different x-ray sources using a...
Curated OER
ng Data: Probability, What's in the bag?
Students use the language associated with probability to discuss events including those with equally likely outcome. They collect data from a simple experiment and record in a frequency table: estimate probabilities based on this data
Curated OER
Cool to Rule: A Game of Prediction and Measurement
Students demonstrate measurement and estimation skills. In small groups, they are given a measurement, predict what object in the classroom is equal to that specific measurement, and record their data in a table that includes the...
Curated OER
Periodic Table & Its Trends-Day 6
Students intergrate science, technology and society into exploring the periodic table. They investigate one element of their choice and write a one page paper on the elements discovery, properties, uses, and the effect on society.
Curated OER
Creating a Nutrition Table in MicroSoftExcel
Middle schoolers access the internet to find Nutritional information from a restaurant of their choice and compile their information into an excel spreadsheet.
Curated OER
Kansas Foods A Data and Probability Investigation
Students study a number of food products and anticipate which are derived from Kansas crops. They make a list of words associated with the food stuffs and graph the results.
Curated OER
WEATHER SATELLITE PREDICTION PROJECT
High schoolers compile weather satellite data from three satellites for one month, obtain weather reports and data from professionals, then create a document with predicted results.
Curated OER
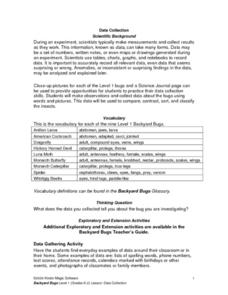
Science: Backyard Bugs Data Collection
Students practice data collection skills by observing common bugs found in their local environment. Once the data is collected they complete data sheets to compare, contrast, sort, and classify the insects. The lesson includes...
Curated OER
Univariate Data Analysis
Students use given data to compare baseball players. They create box and whisker plots to compare the players and determine which they feel is the best player. Students use calculators to make box and whisker plots. They write paragraphs...
Curated OER
Making Sense of the Census
In this unit of lessons, students make sense of the census. They examine why a census is taken and participate in activities.
Curated OER
Energy Choices
Students add and multiply decimals to complete gas choice worksheets. They discover which gas supplier has the best gas prices. Students collect and interpret data about local natural gas suppliers and use this information...
Curated OER
Rouge River Data
Students participate in using Excel sofware in order to create graphs. They create the graphs using data that they gathered during the Rouge River Field Trip they attended. The produce bar graphs from the excel spreadsheets.
Curated OER
Problem-Solving Strategy: Make an Organized List
In this organized list worksheet, students review the problem solving strategy of reading for information and using a math model or organized list to solve the problem. Students then complete the two problems by using organized lists.
Curated OER
How Can We Accurately Make Different Solutions of Different Concentrations?
High schoolers work together to create different solutions made from different concentrations of liquids. They record and analyze their data. They answer discussion questions to complete the instructional activity.
Curated OER
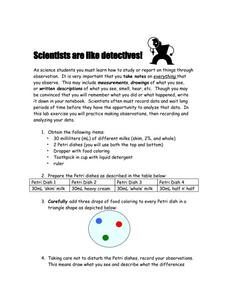
Scientist Are Like Detectives
Students demonstrate proper scientific observation skills. In this investigative science lesson plan, students make observations, record their findings and form conclusions in order to improve their scientific documentation and writing...
Curated OER
Great Tasting Shapes
Fifth graders investigate the concept of median, mode, and range using a simple model for display purposes. They examine different shaped crackers out of a box and identify the ones that occur the most. Then the calculations for the...
Curated OER
An Inventory of My Traits
In this biology activity, students identify and describe a number of easily observable genetic traits and compare the traits they have with other students. Then they identify and describe that some traits are common while others are not...
Curated OER
An "Average" Golf Score
Ninth graders investigate mean, median, and mode. In this mean, median, and mode lesson, 9th graders research gold data for the top ten scores in two golf tournaments. Students make tables and graphs of the data. Students determine...
Curated OER
M&M Graphing
Fourth graders name colors of M&Ms and record answers. They estimate number of M&Ms of each color found in a typical package of M&Ms on piece of paper.They record information on sheet of paper and create a spreadsheet. paper.


