Curated OER
VARIABLES AND PATTERNS, USE AFTER INVESTIGATION THREE. DISCRETE OR CONTINUOUS LINEAR RELATIONS.
Learners discover for which kind of linear function is appropriate to use the "scatter" or the "connected" term. In this instructional activity, students investigate functions using variables, patterns book, graph paper, rulers and the...
Curated OER
Graphing Made Easy
Fourth graders discover the appropriate way to construct and analyze bar, line, picto, and circle graphs. They set up frequency tables and perform some statistical analysis (mean, median, and mode) on their data.
Curated OER
Ohio Census 1990 and 2000
Students explore the Ohio census numbers in 1990 and 2000. In this social studies lesson, students use the census data to answer questions.
Curated OER
Harry Potter Research Project
Young scholars work together to complete a research project on Harry Potter. They write a research question and develop a survey to give to their classmates. Using the results, they create a graph and draw conclusions about the data...
Curated OER
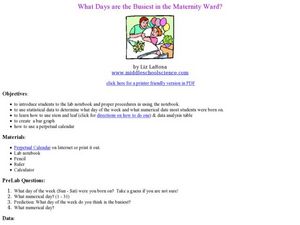
What Days Are the Busiest in the Maternity Ward?
Students form a conclusion using statistical data. In this statistical data lesson plan, students collect and analysis data to form a conclusion about what day of the week most babies are born.
Curated OER
Aquatic Science and IPC
Students explain the importance of water in our daily lives. For this aquatic science lesson, students identify different ways to purify water and make it potable. They design and construct a water filter based on researched information.
Curated OER
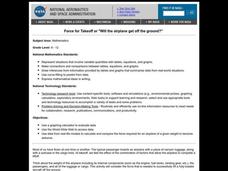
Math: Will The Airplane Get Off the Ground?
Students use data from real-life models to calculate and compare the force required for an airplane of a given weight to become airborne. They use a graphing calculator to evaluate data and use the World Wide Web to access data.
Curated OER
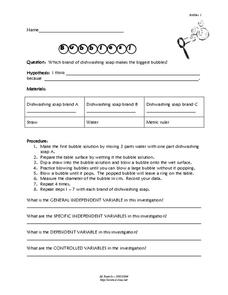
Bubbles
Young scholars experiment bubbles. In this scientific method lesson, students identify variables used in proper experiment design. Young scholars conduct experiments with different brands of dish-washing detergent to determine which...
Curated OER
How does Your Province Stack Up?
Students investigate data about age, and sex of a population. In this statistics lesson, students are given data on a population to analyze and compare to other provinces. This assignment is part of a geography lesson and requires 3...
Curated OER
M&M Math
Pupils sort a bag of M&M candies according to color using a sorting mat. They count M&M candies. They compare the number to their prediction then students create tally charts.
Curated OER
The Predator-Prey Simulation
Students play a game in which they simulate the interactions between a predator, lynx, and a prey, rabbit. Students collect data on the interactions, graph data, and make predictions for populations of several more generations.
Curated OER
Weather Patterns
Young scholars collect weather data over a thirty day period to gain an increased understanding of the weather patterns in their area. Once the data is collected, students post their finding online using a web tool. Finally, young...
Curated OER
Exploring Function Graphs
Tenth graders investigate three different sets of data that relate temperature to another variable in the physical world. These illustrate linear, inverse and exponential relationships.
Curated OER
Mr. Cobbler's Shoe Dilemma
Students employ statistics to solve real-world problems. They collect, organize and describe data. They make inferences based on data analysis. They construct, read, and interpret tables, charts and graphs.
Curated OER
From Probability to Combinatorics and Number Theory
Students see how division is used to help solve probability problems. They use tables as data structures where they are used to count outcomes and to compute probabilities. Students use games to help solve probability problems.
Curated OER
Global Statistics
Students select appropriate data to determine the mean, median, mode and range of a set of data. They calculate the statistical data on literacy rates and life expectancy within each geographic region of the world. Students determine...
Curated OER
Scientific Graphs
Students organize data collected from their experiments using graphs. For this statistics and biology lesson, students organize their scientific data from an article into readable graphs. They define the usefulness of their graph and...
Curated OER
The Normal Distribution
Students investigate normal distribution. In this statistical analysis lesson students investigate the variety of circumstances in which the normal distribution can be used. Students apply the normal distribution to solve problems.
Curated OER
Are Taxes "Normal?"
Students explore the concept of normal distribution. In this normal distribution lesson plan, students find the normal distribution of taxes in the 50 US states. Students make histograms, frequency tables, and find the mean and median of...
Curated OER
What Are The Chances
Students calculate the probability of an event occurring. In this probability lesson, students differentiate between independent, dependent or compound events. They find the range of the data.
Curated OER
Integration: Statistics, Scatter Plots and Best-Fit Lines
In this math worksheet, learners identify the type (if any) of correlation on 6 scatter plots. They use information given on a table to create a scatter plot and identify the type of correlation. Students use the scatter plot to make...
Curated OER
Exploring the Beach
Young scholars explore the beach. In this marine habitat lesson, students inspect sand grains, design beach profiles, classify marine life, and examine natural beach habitats. Young scholars use spreadsheets to record data from their...
Curated OER
The Land of Immigrants
Students access information and data about US immigration using the Internet and other sources. They identify from research data the countries from which the largest number of immigrants to the US come from and create a database of these...
Curated OER
Using Coordinate Geometry by Land, Sea and Outer Space.
Students complete a table of values and plot points, as well as construct a graph on a coordinate grid. They construct two graphs on the same coordinate system, and identify the point of intersection. Students represent and record...


