Cornell University
Thin Films
Combine mathematics and science to calculate measurements of unmeasurable materials. Individuals use knowledge of density and volume to determine the thickness of the film used in production. They also apply stoichiometry to determine...
Curated OER
Cleaning up an oil spill
Small groups complete a science project involving cleaning up an oil spill. In this experiment, pupils use 4 different sorbents to discover which one absorbs the most oil. Afterward, they make a data table.
Curated OER
Access Ramp
Just about every public building that your students are familiar with has an access ramp which complies with ADA requirements. As it turns out, designing such a ramp is an excellent activity to incorporate slope, the Pythagorean Theorem,...
Towson University
Mystery of the Crooked Cell
Can your class solve the Mystery of the Crooked Cell? Junior geneticists collaborate to learn about sickle cell anemia in a fascinating lesson plan. The included materials help them to examine the genetic factors behind the disease...
Curated OER
Modeling Linear Relationships
Young scholars graph lines using the slope and y-intercept. In this algebra lesson, students create data using tables and equations. They use their data to make predictions and draw conclusion.
Curated OER
Why Doesn't My New Shirt Fit?
Learners test Leonardo da Vinci's view of the human body by measuring various body parts using a tape measure. They create a data table and a scatter plot and then analyze and interpret the results using a graphing calculator.
Curated OER
Line Plots - Homework 6.3
Elementary schoolers use data in a table to make a line plot, then answer five related questions. Houghton Mifflin text is referenced.
Curated OER
Algebra 1
Students study the functional relationships of a variety of problems. In this functional relationship lesson, students determine the dependent and independent quantities of a given set of data. Students record the data and write it in...
Curated OER
Investigation-How Many Toothpicks?
Seventh graders use toothpicks to investigate a series of designs and identify patterns. Data is organized and analyzed using tables and graphs, and students make generalizations using algebraic expressions.
Curated OER
Weather's Outer Limits
Students make educated guesses and explain their reasoning and compile, graph, and map weather data. They then study environmental weather extremes on earth and discover that many variables determine climate.
Curated OER
Antarctica’s Melting and the Affect it has on the Ocean
Students calculate how much mass is lost and gained by Antarctica yearly. In this earth science lesson, students graph and analyze data from the given handout. They explain how this affects the world climate.
Curated OER
How's The Weather?
Students make a box and whiskers plot using the TI-73 graphing calculator. Each student would have their own calculator but they would work in small groups of two or three to help each other enter the data and make the plots.
Curated OER
Graphing Pendulum Results
Sixth graders set up a pendulum experiment deciding which variable to manipulate (length of string or weight on the string). They create a hypothesis, collect necessary equipment, and write out each step of their experiment. They then...
Curated OER
Root Caps and the Effect on Gravity Sensing
Students conduct an experiment to determine how the absence of a root cap affects a plant's ability to sense gravity. They make comparisons between capped and decapped roots.
Curated OER
Toothpick Tops
Students assembly tops and name them 1 - 12 so that they can compare their results. They guess which top they think will spin the best and then record data on "Toothpick Top" table. Using a stopwatch or clock to measure and record the...
Curated OER
Anatomy of an Element
Learners discuss matter and atoms using this resource. First, they look at a website describing atoms. Then, they learn about the periodic table and discuss how it is organized. Finally, they create a comic strip to display their...
Curated OER
Endangered Species
Ninth graders graph data in order to compare the number of extinct species and a rise in human population. They analyze the data collected. Students are encouraged to infer the relationship.
Curated OER
Weather Lesson
Learners discuss the weather conditions. They read thermometer, rain gauge, barometer, and wind direction and speed. They record observations of weather conditions and enter information into data base on the computer.
Curated OER
How Do You Get to School?
Third graders talk about all the various ways they get to school. They make a list of all the bus numbers that the students use. They also list all the other methods of transportation used and solidify a hypothesis.
Curated OER
Echinacea No Cure all for Kids
Students look at real data and answer the question of whether or not they would recommend Echinacea to cure a cold. In this investigative instructional activity students describe whether the data supports the hypothesis that echinacea...
Curated OER
How Do You Get to School?
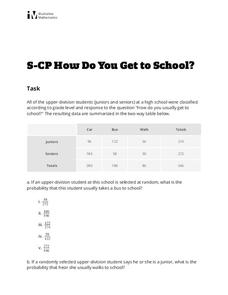
Looking for a short assessment on probability? Learners use a two-way table to calculate a probability and a conditional probability. Multiple choice answers could be eliminated to create a short-answer activity for your class. There are...
Curated OER
How Alike Are We?
Fourth graders find the range, mode, median, and mean for each of the data sets (height and shoe size). They discuss which measure of central tendency for each data set best represents the class and why. Students graph the shoe size and...
Illustrative Mathematics
Haircut Costs
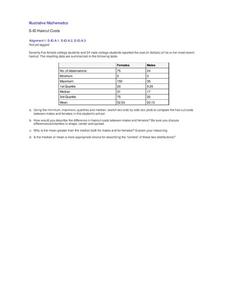
Who pays more for haircuts, men or women? Given quartile values, learners construct box and whiskers plots and interpret the results. They compare the mean and median, and discuss which is more appropriate under particular conditions....
Curated OER
How Much is There to Eat?
Students examine food production related to population density. In this interdisciplinary lesson, students gather data regarding food production in the American South and in India. Students follow the outlined steps to calculate the...


