Curated OER
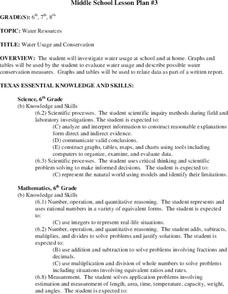
Water Usage and Conservation
Pupils investigate water usage at school and at home. They use graphs and tables to evaluate water usage. Students describe possible water conservation measures. They use graphs and tables to relate data as part of a written report.
Curated OER
Using Computers to Produce Spreadsheets and Bar Graphs
Students review graphing terminology and how to plot data points, how to input data into a spreadsheet, and how to make a chart using a computer.
Curated OER
Cold Enough?
Students read and record temperatures and display the data. They represent the temperatures on an appropriate graph and explain completely what was done and why it was done. Students display the data showing differences in the daily...
Curated OER
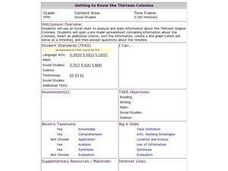
Getting to Know the Thirteen Colonies
Fifth graders analyze information about the thirteen colonies. Using the information, they can manipulate and identify a region in which the colony is located. As a class, they make generalizations about the various regions and time...
Curated OER
The Coyote Population: Kansas Prairies
Students discover animal lifestyles by researching their ecosystem. In this animal statistics lesson, students research the geography of Kansas and discuss the reasons why wild animals survive in the open Kansas fields. Students complete...
Curated OER
Are you an Energy Saver STAR?
Young scholars examine how to use energy more efficiently in their own home. They collect data from their home, complete a chart, read a power meter, interpret the data from an electric and gas bill, and create a poster demonstrating how...
Curated OER
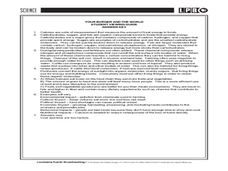
Education for Global Peace
Students survey the class and graph the results. In this graphing and data collection lesson, students conduct a survey to see where their shirts were produced. Individuals use software to graph the results and create a written...
Curated OER
Move It
Studens collect and graph data. In this algebra lesson plan, students use a CBL and CBR with a TI Calcualtor to observe linear graphs. They use the correct vocabualry as they discuss the collected data.
Curated OER
Landfill Project
Students explore impact of garbage on environment, examine waste management operations and how they can directly impact environment, implement ways to lower household garbage, and make STELLA Model about garbage flow and use model to...
Curated OER
Putting Your Best Foot Forward
Third graders measure their feet and their parents' feet, record data on computer-generated graphs, and calculate and record mean, median, and mode.
Curated OER
Rolling Down Hill
Students perform an experiment, collect, and analyze data of a rolling marble down a ramp. They report results after they complete their experiment. Students are assessed in science and writing.
Curated OER
Changes in Pulse Rate
Eighth graders practice making observations and collecting data after determining a baseline pulse rate then collect data on the changes in that rate with exercise. Students must organize their data and analyze their observations.
Curated OER
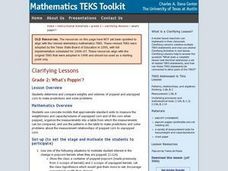
What's Poppin'?
Second graders determine and compare weights and volumes of popped and unpopped corn to make predictions and solve problems. Students combine the data of each group into a graph. They construct questions, statements and story problems...
Curated OER
Statistics Newscast in Math Class
Students study sports teams, gather data about the teams, and create a newscast about their data. In this sports analysis instructional activity, students research two teams and define their statistical data. Students compare the two...
Curated OER
Jumping in the Air - What was your Height?
Students solve equations using the quadratic formula. In this quadratic equations lesson, students use digital cameras to film students jumping and import film clips into a computer. Students use the data in the quadratic formula...
Curated OER
Tracking Your Favorite Web Sites
Ninth graders track the hit count on their favorite web sites. In this Algebra I lesson, 9th graders record the number of hits on their favorite web site for twenty days. Students explore the data to determine if the relation defines a...
Curated OER
Fish Parasite Survey
Students survey and dissect as many fish as possible. They count nematodes, cestodes and crustaceans on the fish, fill out autopsy reports, and transfer data to a chalkboard data table. Students graph the results of the entire class...
Curated OER
Trends of Snow Cover and Temperature in Alaska
Students compare NASA satellite data observations with student surface measurements of snow cover and temperature. They practice data collection, data correlations, and making scientific predictions.
Curated OER
Sunspot Activity
In this space science worksheet, students find the data that is needed to help them acquire the knowledge concerning sunspots through observation and data collection.
Curated OER
Weather Report Chart
Young scholars complete a weather report chart after studying weather patterns for a period of time. In this weather report lesson plan, students measure temperature, precipitation, cloud cover, wind speed, and wind direction for a...
Curated OER
Fast Food: You Can Choose!
Learners research the nutritional value of fast food. They assess which fast foods are best and worst to eat. They organize their data into tables and graphs and explain their findings to other students.
Curated OER
Paper Planes
In this unit, 3rd graders investigate one variable to see if they can make a paper plane fly farther. They use scatter plots to establish a possible relationship between variables then use what they have found to make a paper plane to...
Curated OER
Bullying-studying it to curb it....
Students will engage in a variety of research activities to write what the latest facts are concerning the issue of bullying. This issue is relevant to the lives of learners in schools, which will make for an high interest lesson.
Curated OER
Water Quality in the Greenhills Stream
Seventh graders conduct year long study of water quality over different seasons using variety of probes, including D.O., pH, conductivity and temperature, that are attached to portable technology. Students select three data points in...


