Curated OER
Survey Project
Eighth graders create a website using FrontPage. They use inserted forms to collect survey information and use Microsoft Excel and MS Word to create a presentation of the survey and the results.
Curated OER
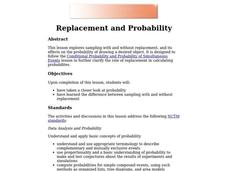
Replacement and Probability
Students explore sampling with and without replacement. They explore the effects on the probability of drawing a desired object. Students examine probability and the difference between sampling with and without replacement.
Curated OER
Is It There?
Students participate in a lesson designed to illustrate these concepts using simple materials. They use Science process skills to observe, measure, predict, make inferences, and communicate while completing the activity. Proper safety...
Curated OER
Vacation Matrix-Integrated Core
Students read aloud, "The Best Vacation Ever," by Stuart Murphy locate vacation spots on a map and describe their own vacations. Students illustrate their summer vacation spot and describe the vacation, placing it on a "vacation matrix"...
Curated OER
Weathervanes in the Wind
Students investigate wind and weather by creating a weathervane. In this environment lesson, students identify the purpose of a weathervane and observe weathervanes in action on their campus. Students create a weathervane and decorate...
Curated OER
Devising a Set of Experiments to Test Water for Dissolved Substances
Students work together to test water samples for pollutants. They design data tables to collect and record their observations. They complete discussion questions to end the lesson.
Curated OER
One, Two, Three...and They're Off
Students make origami frogs to race. After the race they measure the distance raced, collect the data, enter it into a chart. They then find the mean, median, and mode of the data. Next, students enter this data into Excel at which time...
Curated OER
Recording Frequency
First graders analyze nursery rhymes and gather data about word frequency. In this frequency lesson, 1st graders create graphs and tables. Students interpret the data.
Curated OER
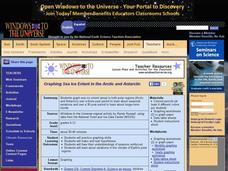
Graphing Sea Ice Extent in the Arctic and Antarctic
Students graph sea ice data and predict long term trends in the data. In this climate change lesson, students use sea ice data from the Arctic and Antarctic to construct line graphs. They use their graphs to predict the effects of global...
Curated OER
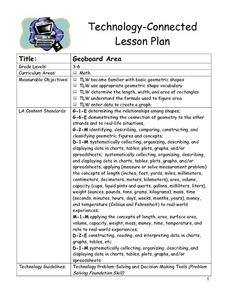
Geoboard Area
Students explore the basic geometric shapes and geometric shape vocabulary through the use of geoboards and virtual geoboards. They create a variety of shapes with a partner, build ten different rectangles on their geoboards, and...
Curated OER
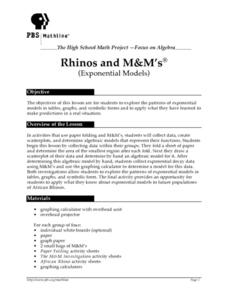
Rhinos and M&M's
Students analyze patterns of exponential models by collecting data in paper folding and M&M investigations. They use graphing calculators to create scatter plots that lead to equations for the exponential models. They then apply this...
Curated OER
What's Your Favorite Planet?
Fourth graders, after listing the nine planets and their differences, choose one planet as their favorite. From the information acquired on each students favorite planet, they make a graph illustrating their favorites and then transform...
Curated OER
Venn Diagram and UK Basketball
Students analyze data and make inferences. For this algebra lesson, students collect and analyze data as they apply it to the real world.
Curated OER
Climate Change
Students compare weather data and draw conclusions. In this climate change lesson plan, students determine whether data collected over a period of ninety years shows a warming trend.
Curated OER
Geography And The Gulf War
Young scholars develop maps, tables, graphs, charts, and diagrams to depict the geographic implications of current world events, and analyze major human conflicts to determine the role of physical and cultural geographic features in the...
Curated OER
The Frozen Desert: Graphing and Comparing Climates
Students explore the concept of climate. They use temperature and precipitation data from their area and other regions to construct climate graphs. These graphs are used to help identify factors that influence climate.
Curated OER
Give Me Some Sugar, Honey!
Students research the history of honey and different products that come from honey. In this bees and honey activity, students review how honey is made, discuss ways people use honey, research the history of honey and its uses, create a...
Curated OER
The Bouncing Ball
Students use the scientific method to conduct an experiment to test how a ball bounces. In this inquiry-based physical science and scientific method lesson, students drop a ball from specified heights and record the rebound, then record...
Curated OER
Get On Board
Students create a ticket table illustrating the cost of tickets by alternative transportation. In this number sense lesson, students write number sentences to compare and contrast difference information in their chart. Students figure...
Curated OER
Bar Graphs
Third graders investigate bar graphs. In this third grade mathematics lesson, 3rd graders collect and analyze data and use the internet’s Graph challenge to create their own graphs. Students write questions for the other students to...
Curated OER
Tall Tale Rollers
Students explore American tall tales. In this tall tale lesson, students discover the six characteristics that are included in tall tales. Students survey their class to find each student's favorite tall tale character and organize the...
Curated OER
Studying Fossils: Hominoid Skull Comparison
Students collect data on the differences in Hominid skulls using acrylic casts of fossil skulls. They measure a series of structures on skulls from six different species then use the data to determine evolutionary relationships between...
Curated OER
Using a Database in Science Experiments
Fifth graders plant and take care of a lima bean plant and make predictions on its growth. In this science lesson, 5th graders chart their records and make conclusions about their experiment.
Curated OER
What's the Fizz Factor
Students as a class create a fountain using both coke soda, and mentos candy. In this science activity, students test which combination of coke and mentos products produce the tallest fountain. Students use the scientific method to track...


