Curated OER
Graphing Scatterplots
Pupils examine scatterplots and determine the equation of a line using the slope-intercept method. Students interpret graphs, draw inferences, and sketch a curve of best fit for the graph. Based upon patterns in the graphs, pupils...
Curated OER
Finding a Line of Best Fit
Pupils engage in the practice of creating a scatter plot with the data obtained from measuring different resting heart rates. The data is used to create the table that is translated into a graph. The lesson gives instructions for the use...
Curated OER
Skittles Lab
Students use Skittles as manipulatives to practice computing decimals from fractions, computing decimals into percentages, and creating bar graphs from gathered data.
Curated OER
Direct and Inverse Variation
Eighth graders participate in two data collection activities that involve direct and inverse variation. In the pre-assessment, 8th graders categorize numerical, graphical, and verbal representations as linear or nonlinear and determine...
Curated OER
The Cost of Smoking
Students explain the financial and life expectancy costs of smoking using a computer model to enter and adjust parameters to collect data in the form of a table. They analyze the data collected and determine the true cost of smoking.
Curated OER
Is Dilution the Solution To Pollution?
Students demonstrate the meaning of dilution and concentration and how pollution can affect the water that you drink. They perform an experiment to calculate the final concentration and dilution factor of solutions. They record the color...
Curated OER
Gravity Lesson
Fifth graders study the effects of mass on gravity. In this gravity lesson, 5th graders make model parachutes and helicopters in order to apply the scientific process and find out the effects of mass on drops of the 2 objects.
Curated OER
Termite Trails
Students observe termite trail-following behavior. In this termite trails lesson, students draw a circle or other shape approximately eight inches across with a ball point pen. Teacher taps out termites into the circle and request that...
Curated OER
Charting a New Course
Students calculate the distance they will travel. In this geometry lesson, students use the TI and CBL system to make calculation of a certain path. They explore geography by calculating distances between different areas as it relates to...
Curated OER
I'm in the Money - Practical Money Skills
Students make a budget and utilize math skills to keep a record of what they spend. They use technology and spreadsheets to help them keep track of their money.
Curated OER
A Thanksgiving Survey
Students take a survey then use the information gained from the survey to help plan a typical Thanksgiving dinner for our last day of class. They create a graph which corresponds the the data gathered during interviews.
Curated OER
Graphs Review
Seventh graders review different types of graphs such as bar graphs, line graphs, box & whisker plots. As a class, they read a story and construct graphs to solve the data in the story. Students play "Graph Jeopardy" which requires...
Curated OER
Possible Outcomes 7
In this math worksheet, 6th graders make predictions about the possible outcomes for two word problems and correlate the data found in the graphic organizer.
Curated OER
Pecan Power
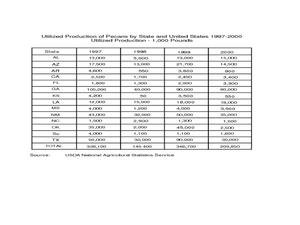
Young scholars study the origins of pecans and complete a bar graph from the data they have discovered. In this pecan lesson plan, students draw pecans, discuss a pecan time line, and draw a bar graph comparing Arizona pecans to other...
Curated OER
Density Destiny
Sixth graders measure and investigate the densities of several objects. They, in teams, determine the mass and volume of each of the 5 objects and record the measurements in the data table.
Curated OER
Discovering Planet X
Students investigate the movements of the planet Pluto. Students participate in a hands-on activity to record data similar to the movements of the planet Pluto. Students compare their data to that found on a website.
Curated OER
Rate of Solution
Eighth graders determine the amount of agitation necessary to dissolve various sized sugar particles. This task assess students' abilities to collect, organize, and interpret data, create appropriate graphs, predict future events based...
Curated OER
An Enzyme- Substrate Model
Students explore reaction rates of an enzyme-mediated reaction. They examine the effects of environmental variables on enzyme function. Students collect, graph, and analyze data relating to the reaction.
Curated OER
Nanofibers: Why Go Small?
Students explore the surface ratio of an object. In this surface area to volume lesson students construct a data table, make calculations and create a graph.
Curated OER
Measuring to the Nearest Inch
Third graders use whole numbers and fractions to make connections between abstractions of the mathematical world and the real world. In this fractions and measurement lesson, 3rd graders identify, quantify groups , and measure distances....
Curated OER
A Focus on Mechanical Friction
Students explore mechanical friction. They perform experiments to observe the direction of mechanical motion and the difference between rolling and sliding friction. Data results on the experiments are recorded and students answer...
Curated OER
Introduction to the Planets
Students become familiar with the members of the solar system and planetary order. They identify differences and characteristics of individual planets. Finally students visualize the great size of the solar system and make the image more...
Curated OER
Growing Rock Candy
Students observe the growth of rock candy. In this crystal growth activity, students make rock candy and measure the crystal growth over five days.
Curated OER
What Part of the Earth's Surface is Covered by Oceans?
Third graders investigate oceans. In this Earth science lesson, 3rd graders predict how much of the Earth's surface is covered by oceans. Students determine if their predictions are accurate by throwing a globe to each other and then...


