Curated OER
We Are Having a Party! Part II
Second graders, in groups, participate in a four-station rotation model to solve problems. They use coins and dice for stations one, two, and three.
Curated OER
We Are Having a Party! Part I
Second graders use data analysis skills in order to plan a class party. They graph possible times for the party noting the range for times. They discuss how mathematicians find and use the range to analyze data.
Curated OER
What's Your Favorite Stuffed Animal?
Second graders gather information in a survey and interpret the results using a tally chart, a table, and a bar graph. They' present their results of the during the final group discussion. The subject of the survey is favorite stuffed...
Curated OER
The Stock Exchange Phase I
Second graders select a stock and follow its ups and downs, using graphs to show its success.
Curated OER
Snow Cover By Latitude
Students examine computerized data maps in order to create graphs of the amount of snowfall found at certain latitudes by date. Then they compare the graphs and the data they represent. Students present an analysis of the graphs.
Curated OER
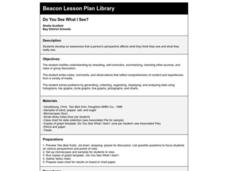
Do You See What I See?
Students observe and describe different objects seen under a microscope and compare the individual perspectives of what was seen.
Curated OER
Heads-Up Probability
Second graders use tree diagrams to predict the possible outcomes of coin tosses. The data they collect and graph also help them predict the likelihood of getting heads or tails when tossing coins the next time.
Curated OER
Environmental Mathematics
Eighth graders determine food that they would need to survive in the wild. They graph the best foods for their environments and rate the survivability rate for each member of their group.
Curated OER
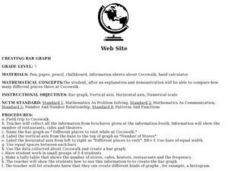
Creating Bar Graph
Seventh graders, after an explanation and demonstration compare how many different places there at Cocowalk.
Curated OER
Cloudy Days Are for Reading and Writing
Young scholars consider a variety of well-known proverbs that refer to the weather. They research the scientific validity of these proverbs, conduct interviews about public perception of the proverbs and summarize their findings in writing.
Curated OER
Rotation Sensor Challenge
Students participate in a challenge to construct a rotation sensor with the highest degree of accuracy and repeatability. They conduct computer analysis of their sensor using repeated trial.
Curated OER
Capturing the Wind
Students collect and analyze data about wind speed. They build a Lego wind sail and measure the wind speed with a rotation sensor. They use software to analyze the data.
Curated OER
MOBILITY, Traveling Lightly: What’s My Footprint?
Students calculate their carbon footprint. For this environmental technology lesson, students listen to a lecture on climate change. Students brainstorm solutions to reduce environmental impact based on travel options. Students calculate...
Texas Instruments
Texas Instruments: Glencoe: Graphing Calculator Investigation Histogram
Students will make histograms, find the frequency of each interval and explore the domain.
CK-12 Foundation
Ck 12: Statistics: Histograms Grades 9 10
[Free Registration/Login may be required to access all resource tools.] Make a histogram given a frequency table.
University of Georgia
University of Georgia: Inter Math: Histogram
This site provides details about histograms. The site contains a link on the step by step procedure of creating a histogram. There are links to related terms, everyday examples, challenging problems, more information, and the interactive...
CK-12 Foundation
Ck 12: Statistics: Stem and Leaf Plots and Histograms
[Free Registration/Login may be required to access all resource tools.] Make and interpret stem-and-leaf plots and histograms for a set of data.
CK-12 Foundation
Ck 12: Statistics: Histograms Grades 11 12
[Free Registration/Login may be required to access all resource tools.] This Concept covers making frequency tables and using them to create a histogram.
CK-12 Foundation
Ck 12: Statistics: Histograms Grade 7
[Free Registration/Login may be required to access all resource tools.] Make a histogram given a frequency table.
Scholastic
Scholastic: Shake, Rattle & Roll
Students will learn and reinforce skills for creating and analyzing scatterplots and histograms; using cost-benefit analysis to make predictions from data and using tree diagrams to understand outcomes of events.
Texas Instruments
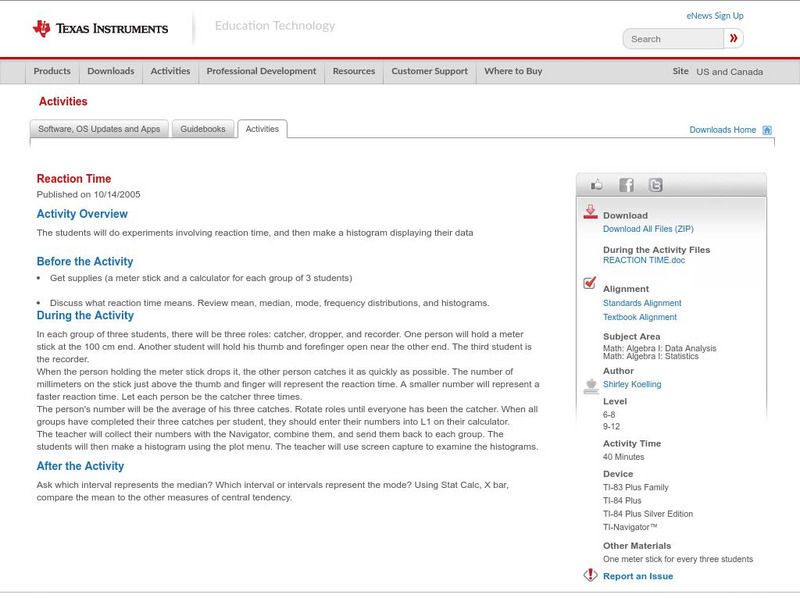
Texas Instruments: Reaction Time
The students will do experiments involving reaction time, and then make a histogram displaying their data.
Texas Instruments
Texas Instruments: Cannibal Critters and Cannibal Critters Cont.
Students will explore probability and statistics using predictions and histograms. Theoretical and experimental probability will also be examined.
Other
Laus Dnet: Grade 5 Excel Lesson Plan
In this online instructional activity, students will survey students in their school to determine their favorite type of hand-held ice cream. Before performing the survey, students will make predictions about which ice creams they think...


