Shodor Education Foundation
Introduction to the Concept of Probability
Acquaint mathematicians to the concept of probability with a discussion about the results of a game. Then have them play a dice, card, spinner, or coin game and recording the number of wins vs. the number of tries on an interactive web...
Curated OER
Leaf Weight-Loss Plan
Students measure the weight of a container of leaves daily to discover how quickly it grows lighter as the foliage dries.
Curated OER
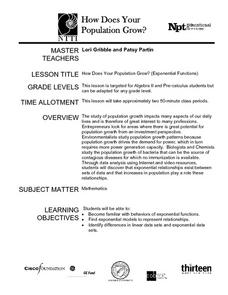
How Does Your Population Grown?
Do you know how the population has grown of your community? Can you predict the population over the next half century? Can we find an algebraic model that matches our data? These along with many more questions can be researched by...
Curated OER
Fire!, Probability, and Chaos
Upper elementary and middle schoolers work with the concept of probability. They are introduced to the concept of chaos. Learners graph and analyze using a line plot, work with mean, and are introduced to the concept of variance.
Curated OER
Off to College
High schoolers investigate linear, quadratic and exponential equations using the TI calculator. They identify relation and functions using ordered pairs, graph the data, analyze the data, and relate it to real-world situations.
Curated OER
What Can Scatterplots Tell Us?
Eighth graders use data from surveys conducted with parents, peers and themselves to create computer-generated scatterplots. They make inferences from their scatterplots.
Curated OER
Probability: Playing with Fire
Students use probability to determine how likely it is for each tree in a small forest to catch on fire.
Curated OER
Escape The Hangman
Seventh graders investigate the concept of probability. They use the game of hangman to create engagement and context for conducting the lesson. They create a spreadsheet with data that is given. Students make predictions based on data.
Curated OER
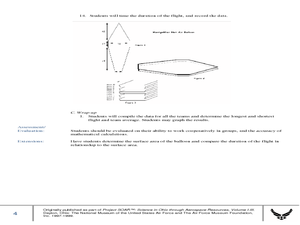
Up, Up and Away with the Montgolfier Balloon
Students construct hot air balloons. In this science lesson plan, students assemble their own balloon using tissue paper and glue. They time the duration of the flight, record data and calculate team averages.
Curated OER
What Happens on Average
Fifth graders are introduced to convergence of sequences based on averaging previous terms in the sequence. The power of the "fill-down" function in spreadsheets is exploited. By using various starting numbers, and inferring the limit,...
Curated OER
Sample This
Students gain a greater understanding of how statistical samples are conducted by taking polls of specific populations. These polls be expressed in graphs, which be compared with the same questions asked of other populations.
Curated OER
Using Computer for Statistical Analysis
Students examine the use for spreadsheets in analyzing data. They make spreadsheets that display and calculate a given data set such as temperature change.
Curated OER
Plotting Wind Speed and Altitude
Students construct, read and interpret tables, charts and graphs. They draw inferences and develop convincing arguments that are based on data analysis. They create a graph displaying altitude versus wind speed.
Curated OER
Maverick
Young scholars apply probability to real life situation. For this statistics lesson, students play poker and make predictions on what hand they will get next. They apply their knowledge of how probability works to make their predictions.
Curated OER
Collecting, organizing and comparing data for cellular telephone buying and calculating average, and median price and best deal per cost.
Students research data and develop statistical methods such as mean and median price and make convincing arguments as powerful ways for decision making.
Curated OER
Decomposing Artifacts
Seventh graders participate in an experiment in which they calculate the time of decomposition of different materials. In groups, they fill bags with different materials and cover them in soil. After six months, they create a line graph...
Curated OER
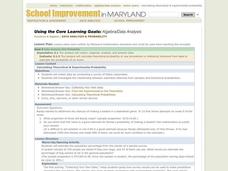
Calculating Theoretical & Experimental Probability
Students explore the concept of experimental and theoretical probability. In this experimental and theoretical probability lesson, students collect data by conducting a survey of their classmates. Students compare their data and discuss...
Curated OER
Introduction to Scatter Plots and Correlation
High schoolers examine the concept of scatter plots. They compare baseball statistics to locate the ones that correlate with winning, and identify the positive, negative, and no correlation in sets of data using MS Excel.
Curated OER
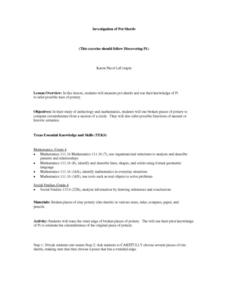
Investigation of Pot Sherds
Fourth graders review their prior knowledge on the concept of pi. Using broken pieces of pottery, they calculate the circumference from a section of the circle. In teams, they compete against one another to get the most accurate...
Curated OER
A Geological Puzzle
Students compare and contrast the various types of rocks on each continent. In groups, the calculate the rock ages and types to determine if the continents, in their opinion, were joined at one time. They develop two imaginary...
Curated OER
Sea Ice: Unscrambling the Egg Code
Students determine sea ice thickness, concentration, and floe size by reading egg codes. In this sea ice conditions lesson, students color code a map based on prescribed criteria and use the maps to identify changes in sea ice...
Curated OER
Weather Observation Journal
Students record weather for a period of one month. In this weather lesson, students observe weather for one month on a large pictograph. Students record clouds, wind, temperature and any other weather conditions they observe. Students...
Curated OER
Planning for and Surviving Earthquakes
Students work in small groups to explore the FEMA for Kids site. They take the role of FEMA officials. Student list three items they may need to survive an earthquake. They complete a worksheet and discuss their results with the rest of...
Curated OER
Build a Weather Vane
Third graders measure wind direction. In this weather lesson plan, 3rd graders build a weather vane from a straw, skewer, spool, and flag. Students measure wind direction using their weather vane.


