August House
Anansi Goes to Lunch - Kindergarten
Greed is the theme of the West African folktale, Anansi Goes to Lunch and this multidisciplinary collection of lessons. First, scholars listen to a read aloud and participate in a grand conversation about the book's key details and...
Colorado State University
If You Can't Predict the Weather, How Can You Predict the Climate?
Why is the weather man wrong so often? Young climatologists discover how chaos rules both weather and climate through a math-based activity. Using an iterative equation, the class examines how small day-to-day weather events total up to...
NOAA
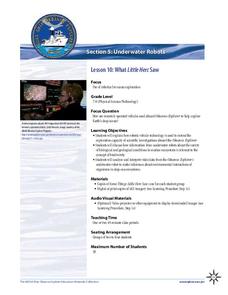
What Little Herc Saw
See the underwater world through a different pair of eyes! Middle school marine biologists identify deep-sea organisms by examining images taken by an ROV from the Okeanos Explorer. After determining what creatures lie beneath the...
Curated OER
Make a Pass at Me
Students identify different types of functions and units of measurements. In this statistics lesson, students will collect data, graph their data and make predictions about their data. They plot a linear regression graph.
Curated OER
Math Lesson: What Do You Want to Know? - Country Statistics
Students are able to identify the characteristics of a variety of graphs (i.e. bar graph, line graph, pie graph, scatter plot, population pyramids, etc.) They recognize how the type of data to be presented plays a role in choosing the...
Curated OER
Food for Spaceflight
When astronauts get hungry in outer space, they can't just call and have a pizza delivered. In order to gain an appreciation for the challenges associated with space travel, young learners are given the task of selecting,...
Curated OER
Data Analysis Using Technology
Analyze data using technology. Middle schoolers design data investigations, describe data, and draw their own conclusions. Then they select the best type of graph, graph and interpret the data, and look for patterns in trends. They also...
Intel
Energy Innovations
Collaborative groups examine the importance of energy resources on quality of life by researching different energy sources and alternative energy sources through data analysis. They make a comparison of different countries and cultures,...
Curated OER
In Touch with Apples
Students read "How To Make an Apple Pie and See the World", the story of a girl who traveled the world to find the ingredients to make her apple pie. They conduct a series of interdisciplinary activities including testing their senses,...
American Statistical Association
Happy Birthday to . . . Two?
How many people do you need in a room before two likely share the same birthday? Scholars consider this puzzle by analyzing a set of data. They ponder how to divide the data and determine the proper size of a group for this event to...
Curated OER
Inference Multiple Choice Version 1
In this reading skills worksheet, learners read 8 sets of sentences and make inferences about the given situations. Students should note why their inferences make sense.
Visa
Make It Happen: Saving for a Rainy Day
Every little penny counts, especially when it comes to saving for emergencies or long-term goals. Pupils evaluate different saving and investment strategies, such as a CD or money market account, through worksheets and by...
Curated OER
Gummy Bear Math
First graders predict, collect data, and create a graph based on gummy bear colors they are given. In this graphing lesson plan, 1st graders first predict how many colors of gummy bears there are. They then count the colors, graph them,...
Curated OER
Inference Makes the Difference
Young scholars explore how archaeologists make inferences from artifacts to explore what life was like in the past. In this archaeology instructional activity, students work in groups and make inferences about an imaginary household...
Curated OER
Inferences i: Pretest
In this inferences instructional activity, learners answer multiple choice questions about inferences after reading passages. Students answer 6 questions total.
K5 Learning
Humming Birds
Seeing a hummingbird in the wild can be a magical experience. Learn more about these delicate members of the animal kingdom with a short reading passage, complete with four short-answer questions.
Statistics Education Web
Sampling in Archaeology
Compare different random sampling types using an archaeological setting. Scholars collect data from an archaeological plot using simple random samples, stratified random samples, systematic random samples, and cluster random samples....
NTTI
Line 'Em Up!
Coordinate planes and Cartesian graphing systems are the focus of this math lesson. Learners use video, internet activities, and engage in hands-on activities in order to explore coordinate planes. The materials needed for this lesson...
Curated OER
Can You Measure Up?
Here is a well-designed lesson on common standards of measurement for your young mathematicians. In it, learners calculate measurements in standard and non-standard units. They make predictions, record data, and construct and design...
Curated OER
Quarter, Nickel, Dime....
An engaging game called, "Quarter, Nickel, and Dime" is presented in this math lesson. Players are given an envelope with slips of paper that represent the three coins. In pairs, they play the game 18 times, and the whole class charts...
Curated OER
Monster Data
An inventive lesson shows learners how to collect, organize, and present mathematical data. They access websites which lead them through a variety of ways to engage in data collection. They get to design and create graphs, and present...
Curated OER
Basic Excel
Students explore basic Excel spreadsheets. In this spreadsheet lesson plan, students enter Alaska weather information and perform calculations. Students title the columns on the spreadsheet and format the cells. ...
Noyce Foundation
Ducklings
The class gets their mean and median all in a row with an assessment task that uses a population of ducklings to work with data displays and measures of central tendency. Pupils create a frequency chart and calculate the mean and median....
Virginia Department of Education
Graphs
Examine different types of graphs as a means for analyzing data. Math scholars identify the type of graph from a series of data displays and then develop questions to match each one. Then, given a scatter plot of height versus age...


