Curated OER
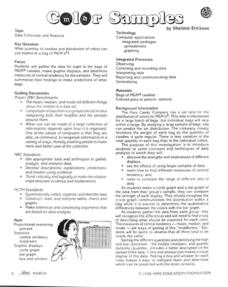
Colors Samples
In this math worksheet, students take the time to count out the colors of the candies. They graph the results and make inferences from the information.
Curated OER
Event Graphic Organizer
In this event graphic organizer worksheet, students identify an event, record details, list prior knowledge, make inferences, and make a conclusion.
Curated OER
Advanced Critical Reading: Ethanol
In this advanced critical reading learning exercise, students read a passage about ethanol then answer questions. Students make inferences, determine author's purpose and use context clues to find the meaning of unknown words in the...
Curated OER
Literature-based Skill Building:Holesby Louis Sachar
In this literary elements worksheet, students read chapters 26, 27, and 28 of Holes by Louis Sachar and then respond to 13 short answer questions regarding setting, conflict, and inference.
Curated OER
Where the Red Fern Grows Chapter 16-17
Find out how much your class understood of the listed chapters of Wilson Rawls' novel. Class members respond to eight plot and character questions before looking closely at an instance of personification from the text. The resource is...
Curated OER
Literature Comprehension
In this reading comprehension instructional activity, students use the SADDR method to understand the literary tools used in a book. Students complete a speech analysis, action analysis, description analysis, drawing activity, reactions...
Curated OER
Making Money and Spreading the Flu!
Paper folding, flu spreading in a school, bacteria growth, and continuously compounded interest all provide excellent models to study exponential functions. This is a comprehensive resource that looks at many different aspects of...
University of Georgia
Energy Content of Foods
Why do athletes load up on carbohydrates the evening before a competition? The lesson helps answer this question as it relates the type of food to the amount of energy it contains. After a discussion, scholars perform an experiment...
Memorial Art Gallery
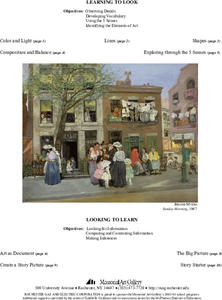
Learning to Look, Looking to Learn - Sunday Morning
Jerome Myers' depiction of the urban landscape in "Sunday Morning" is the focus of a series of activities that asks viewers to examine how an artist uses the elements of a painting to tell a story. The resource packet includes an...
PBS
Does Art Imitate Life?
Write what you know, sound advice for any writer and something many famous authors are known to have done. Use these materials to explore how Shakespeare's life influenced his plays. This resource is packed with readings, video segments,...
KERA
Matisse and Picasso
Discover Modernism through the eyes of artists. Over the course of six well-thought-out lessons, learners examine works by Pablo Picasso and Henri Matisse while completing a range of collaborative and hands-on activities. A great resource!
Noyce Foundation
Ducklings
The class gets their mean and median all in a row with an assessment task that uses a population of ducklings to work with data displays and measures of central tendency. Pupils create a frequency chart and calculate the mean and median....
Virginia Department of Education
Graphs
Examine different types of graphs as a means for analyzing data. Math scholars identify the type of graph from a series of data displays and then develop questions to match each one. Then, given a scatter plot of height versus age...
Midland Independent School District
Drama
Ten drama lessons are the perfect addition to your language arts or theater class. With a focus on script elements, plot development, and parts of a dramatic story, the lessons guide young playwrights through the steps of telling a story...
EngageNY
Using Sample Data to Compare the Means of Two or More Populations II
The 23rd segment in a series of 25 presents random samples from two populations to determine whether there is a difference. Groups determine whether they believe there is a difference between the two populations and later use an...
UAF Geophysical Institute
Carbon Footprint
Your young environmentalists can calculate their carbon footprint and discuss ways to reduce it with a worksheet about climate change. After reading a handout about what impact one's carbon footprint can have on the environment, kids...
IPDAE
Themes in Short Stories
"What is the theme of this story?" The very question can spark fear in the minds of readers and incinerate confidence. Here you will discover an exercise that shows how writers use the tools of setting, plot, conflict, and...
UAF Geophysical Institute
System Interactions: The Lorax and the Truffula Tree
If the Lorax were to write a letter, what would he write? Introduce your class to systems and feedback loops through the whimsical stylings of Dr. Seuss. Learners take on the Lorax's point of view to write a letter, among other activities.
Achieve
Task: Storage Sheds
Bridge the gap between mathematics and Career Technical Education. Pupils research the cost associated with building storage sheds and analyze possible profit. They build scale models and determine if building and selling the sheds is a...
EngageNY
Using Sample Data to Compare the Means of Two or More Populations
Determine whether there is a difference between two grades. Teams generate random samples of two grade levels of individuals. Groups use the mean absolute deviation to determine whether there is a meaningful difference between the...
NASA
The Discovery of Jupiter Radio Waves
Lead your class on a journey to the planet Jupiter and provide them with fun facts in the process. Learners explore radio waves emitted by Jupiter to further understand how this data helps our daily lives. They conclude by discussing...
UAF Geophysical Institute
Observing the Weather
How can you predict the weather without any technology? Young scientists learn to forecast the weather using traditional Native American techniques. Based on their observations of the weather, as well as talking to their classmates, they...
Curated OER
Schedules & Technology
Learn more about technology through matching, dictation, and word identification. English learners will participate in a variety of activities as they learn more about technology.
Google
Surveys and Estimating Large Quantities
Looking for an estimation activity a bit more involved than the typical "guess the number of jellybeans in the jar" game? Here, learners use a picture to estimate the number of people at a large event, look for potential problems with...


