Curated OER
Archeology of the Future
Students are introduced to the basic vocabulary of archeology. Using the vocabulary, they classify artifacts and make inferences about their uses. In groups, they create a chart for the criteria needed to analyze artifacts and share...
Curated OER
Excavating the Trash
Students look at a day's accumulation of recyclable trash from first through fifth grade classrooms, not knowing which classes it came from. After setting up a collection sheet for data, students remove items from the receptacle and...
Curated OER
Mr. Cobbler's Shoe Dilemma
Students employ statistics to solve real-world problems. They collect, organize and describe data. They make inferences based on data analysis. They construct, read, and interpret tables, charts and graphs.
Curated OER
How to "Read" an Artifact
Students discuss the types of information they can get from artifacts. In groups, they practice "reading" artifacts and determining their usage. They use inferences to test against official information about certain pieces. They also...
Curated OER
Biochemistry Detectives
Students explore the process of chemosynthesis and relate it to the biological communities in cold seeps. In this biochemistry instructional activity students interpret analyses of enzyme activity and draw inferences about organisms in...
Curated OER
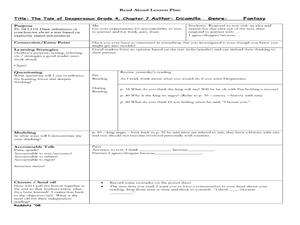
The Tale of Despereauz
Fourth graders read text and draw inferences or conclusions about the text. In this reading lesson, 4th graders discuss their opinions on what was read and state why they think that way to a partner.
Curated OER
Circles Minilab
Young scholars learn how to measure the diameter and circumference of a circle. In this circle lesson, students organize their data to create a graph. Young scholars utilize their graph to make an inference about the slope of pi.
Curated OER
What Makes you Hot?
Learners manipulate different variables in a model and make inferences about the temperature on Earth. In this heat lesson students calculate the blackbody radiation of an object at a certain temperature.
Curated OER
Rhetorical Devices
Twelfth graders identify and analyze examples of rhetorical devices as valid or invalid inferences. In this text analysis lesson, 12th graders research a controversial topic in teams and identify rhetorical devices for the topic....
Curated OER
Catches and landed value of fish
Young scholars analyze data. In this secondary mathematics lesson, students read and retrieve data from a statistical table on the Canadian fishing industry. Young scholars interpret and describe data in mathematical terms...
Curated OER
Night of the Twister
Students use reading strategies for Night of the Twister. In this reading strategies lesson, students name five major catastrophes and books about each. Students complete a vocabulary section, make inferences and predictions, read the...
Curated OER
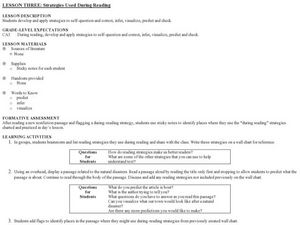
Strategies Used During Reading
Young scholars try a variety of reading strategies. In this reading strategy lesson, students read a nonfiction passage and put Post -Its to mark the spots where they are using a reading strategy. They focus on inferring, predicting,...
Curated OER
Solutions, Solutions, Could it Be?
Students graph and solve linear system of equations. In this algebra lesson, students use algebraic and graphing methods to solve their systems. They find the point of intersection for their solution and draw inference from their data.
Curated OER
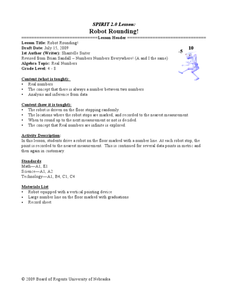
Robot Rounding!
Students collect data on a robot and relate the behavior to prove there is an infinite minute set of numbers. In this algebra lesson, students verify that there is always a number between two numbers. They analyze and make inference...
Curated OER
A Snapshot of the Connecticut River Valley - 1880
Students analyze a variety of images and documents and make inferences from their readings and articulate causality.
Curated OER
More on Temperature and Solubility
Students discover how temperature effects the solubility of solutes by experimenting with a range of temperatures. They develop skills for observing, inferring, measuring, comparing and contrasting.
Curated OER
Temperature Effects on Solubility
Students determine the solubility of salt in water at three different temperatures and graph the results. They use the following skills: observing, inferring, and graphing.
Curated OER
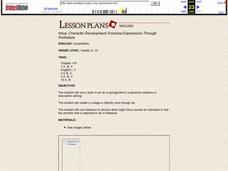
CHARACTER DEVELOPMENT: EXAMINE EXPRESSIONS THROUGH PORTRAITURE
Students use a work or art as a springboard to a personal narrative or descriptive writing, create a collage to identify tone through art, and use inference to discern what might have caused an individual to feel the emotion that is...
Curated OER
Go Jump In The Lake!
Middle schoolers experiment with local lake water to determine the health of the lake waters. They explore the human impact on the lake water, hypothesize and share inferences in a scientific report.
Curated OER
Interpreting The Past Through Images
Students explore the geographic features, structures, and means of transportation and livelihood from Alabama's past. They analyze a photograph to gather historical information and make inferences from historical images.
Curated OER
Learning From Leaves: A Look at Leaf Size
Students measure and analyze leaves from various environments. They discuss the environments, and make inferences about environmental variables that could have contributed to the differences in leaf size and texture.
Curated OER
Experiences and Experiments - There is a Difference
Sixth graders plan and conduct an experiment on food spoilage. They design the experiment, create a display, record and analyze data, and make inferences regarding the results of the experiment.
Curated OER
Sun, Shadows, Surface Structure...and the Face on Mars
Students use light and shadow information to make inferences regarding the three dimensional shapes of specific objects photographed on the surface of Mars. Limitations of the of the data provided are discussed and entries made into the...
Curated OER
Colored Dots 1
Students observe that colored markers are a mixture of many different colors by performing a chromatography experiment. They make observations, record information, and make generalized inferences from their observations.


