Museum of Tolerance
Developing Media Literacy
To protect young people from questionable content, many schools limit access. This resource suggests that because learners can so readily avail themselves to unrestricted Internet access, it is vital for 21st century...
NOAA
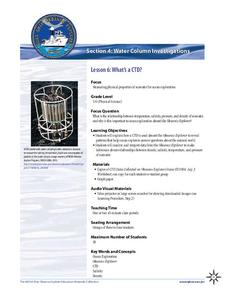
What's a CTD?
Why are the properties of the water important when exploring the ocean? Young scientists discover the tools and technology used in deep sea exploration in the fourth installment in a five-part series. Groups work together to...
Curated OER
Transparent Shoebox Dig
Take this simulated archaeological dig one layer at a time with your young pupils to encourage observation, critical thinking, and careful attention. Using a transparent box full of layers of sand and artifacts, pupils examine the...
Towson University
Mystery Tubes
How do scientists know they're right? Truth be told, they don't always know. Explore the scientific process using mystery tubes in an insightful activity. Young scientists discover how to approach and solve problems in science, how ideas...
Statistics Education Web
You Will Soon Analyze Categorical Data (Classifying Fortune Cookie Fortunes)
Would you rely on a fortune cookie for advice? The instructional activity first requires future statisticians to categorize 100 fortune cookie fortunes into four types: prophecy, advice, wisdom, and misc. The instructional activity goes...
NOAA
A Quest for Anomalies
Sometimes scientists learn more from unexpected findings than from routine analysis! Junior oceanographers dive deep to explore hydrothermal vent communities in the fourth lesson in a series of five. Scholars examine data and look for...
NOAA
Off Base
How does carbon dioxide affect the world's oceans? The final installment in a series of six lessons has pupils research ocean acidification, then conduct an experiment to witness the delicate balance that exists in our seas. Materials...
Towson University
Looking Backwards, Looking Forward
How do scientists know what Earth's climate was like millions of years ago? Young environmental scholars discover how researchers used proxy data to determine the conditions present before written record. Grouped pupils gain experience...
Curated OER
Idea-Noun Definition: Source Searching
A great idea for showing language arts pupils the universality of themes, even in the real world! Have class members choose an idea-noun (peace, justice, war, love, etc.) at the beginning of the year or semester. They complete weekly...
Curated OER
What Can Scatterplots Tell Us?
Eighth graders use data from surveys conducted with parents, peers and themselves to create computer-generated scatterplots. They make inferences from their scatterplots.
Ohio Department of Education
Observe Then Infer
Upper elementary scientists learn that observations made can lead to inferences. They rotate through six weather-related stations that challenge them to make observations and then draw inferences from their observations. A...
Curated OER
Mysterious Footprints
Students, after observing and responding to two pictures, consider the interaction of two unknown animals by examining the pattern of their footprints. They make observations, draw conclusions and propose possible explanations for the...
Curated OER
Wilson Stands Alone in His Plan for World Peace
Students study the Fourteen Points. They examine motives behind Wilson's Fourteen Points and why most of them were rejected by France. They answers questions concerning primary resources (casualty list and before and after...
Curated OER
Venn Diagram and UK Basketball
Students analyze data and make inferences. In this algebra lesson, students collect and analyze data as they apply it to the real world.
Curated OER
Civil Rights Movement
Students identify and acquire an understanding of what the Civil Rights Movement consisted of, the issues that sparked the Movement, the people who participated and the events that occurred during the Movement. They also identify how to...
Curated OER
Seeing Sound & Sonar
Students make inferences based on different sounds that they hear. In this inferences lesson plan, students will hear sounds of different objects and describe the sounds based on what they hear. They will answer various questions about...
Curated OER
The Family: Louisiana Family Folklore
Students explore and identify family treasures and research the history to each one. They also organize a variety of artifacts into various categories and research traditional Louisiana artifacts online. Each student draws inferences...
Curated OER
A Geological Puzzle
Students compare and contrast the various types of rocks on each continent. In groups, the calculate the rock ages and types to determine if the continents, in their opinion, were joined at one time. They develop two imaginary...
Curated OER
My Daily Life in Kansas
Second graders use 'Read Kansas' cards to learn about the daily life activities of an Osage boy and a pioneer girl. In this similarities and differences lesson, 2nd graders write a paragraph and draw a picture comparing...
Curated OER
Kinetic Molecular Theory
High schoolers analyze and evaluate evidence that matter is made of tiny particles. They observe a series of phenomena involving solids, liquids, and gases to make inferences about the spacing, interactions and relative kinetic energies...
Curated OER
Venn Diagrams
Students collect and display data in a Venn Diagram. In this statistics lesson, students collect data, compare the data and make inferences about their data. They use the Venn diagrams to identify what the data have in common and how...
Curated OER
Sonar Simulation
Students compare and contrast side-scan sonar to other methods used to find objects underwater. In this underwater search lesson, students describe side-scan sonar and make inferences about the topography of an unknown landscape. This...
Curated OER
Artifact Identification-What is it?
Students observe an artifact and make an inference about the artifact's purpose. They are going to role-play as archaeologists by using artifacts to hypothesize about the lives of past people.
Curated OER
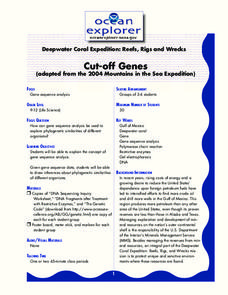
Cut-Off Genes
Students explain the concept of gene sequence analysis. In this gene lesson, students draw inferences about phylogenetic similarities of different organisms.


