Curated OER
M&M's Candies Worksheet Graph
In this graphing worksheet pupils will record data on a bar graph. Students will take a bag of M&M's and chart the colors they find inside this bag.
Curated OER
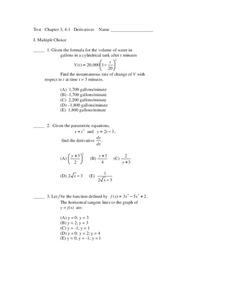
Twenty Multiple Choice and Free Response Derivative Problems
In this derivative worksheet, students solve ten multiple choice and ten free response problems. These problems include: derivatives of trig functions, tangent lines, parametric equations, and instantaneous rates of change.
Curated OER
Graphing Situations without a Table
Students graph a line without making a table of vales. In this algebra lesson plan, students are given a verbal scenario and asked to write a linear functions representing the scenario and graph it on a number line without making a...
Curated OER
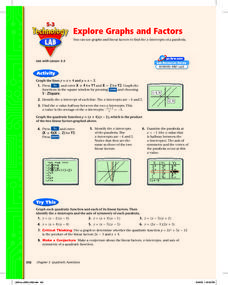
Explore Graphs and Factors
Pupils graph the factors of a quadratic as linear equations and graph the parabolic equation in factored form. Also, they investigate the relationship between the x-intercepts of the lines and the zeros of the parabola.
Curated OER
Study Guide: Rational Numbers
For this rational numbers worksheet, students solve and complete 8 different problems that include applying the comparison property and density property for rational numbers. First, they replace each blank with the correct symbol to make...
Curated OER
Generate Measurement Data Word Problems
Using a set of simple data, learners create a line plot to organize the information. This data includes only single-digit numbers and the highest number is six. Because the answer is explained and illustrated at the bottom, project this...
Curated OER
Generate Measurement Data Word Problems
Plot data for three word problems, each with a table of data. Learners create line plots for these, all of which have only single-digit whole numbers. The large text and few number of problems make this ideal as a whole-class warm up....
Curated OER
Is there Treasure in Trash?
More people, more garbage! Young environmentalists graph population growth against the amount of garbage generated per year and find a linear model that best fits the data. This is an older resource that could benefit from more recent...
Curated OER
One Size Fits All, Part 1
Can you tell how tall someone is just by looking at their feet? In this activity, young mathematicians measure their height, arm span, and foot size, graph their findings, and answer questions about how these measurements are related....
Curated OER
Graphs: All About Our Class
Students respond to survey questions, discuss results, brainstorm ways to represent survey information, and create table of class results. They find mean, range, and percentages, and create graph to display results.
Curated OER
Data With Candy
Students, while utilizing the classroom and the computer lab with a bag of colored candy, gather and interpret data, calculate averages and draw conclusions and draw a bar graph. They estimate how many candies are in the bag, what...
Curated OER
A Sweet Drink
Students investigate reaction rates. In this seventh or eighth grade mathematics lesson, students collect, record, and analyze data regarding how the temperature of water affects the dissolving time of a sugar cube. Studetns...
Curated OER
Solving Inequalities
This is a nice learning exercise on solving one variable and compound inequalities. Learners solve inequalities and graph the solution on a number line. The two page learning exercise contains explanation and sixteen practice...
Curated OER
Lesson 19: Rational Functions and Long Division
Explore rational functions with this packet. A lot of information is provided, including several examples. Learners graph rational functions and find vertical, horizontal, and oblique asymptotes. This seven-page worksheet contains...
Curated OER
Classroom Supplies
Challenge young mathematicians to buy classroom supplies by staying within the means of a $1,000 budget. The mathematical activity provides learners with the opportunity to decide what items from the supply list would benefit a class of...
Curated OER
Generate Measurement Data Word Problems
Beginning graphers will appreciate this practice with basic bar graphs. For each table of data, there is a corresponding graph for learners to match it to. The five data sets all have the same two...
Curated OER
Ordering Integers
Sixth and seventh graders compare and order integers. After locating integers in a newspaper, they describe examples of negative and positive integers. They draw a thermometer and locate positive and negative integers on the scale. In...
Curated OER
Charting Attendance Rate of Busch Gardens
Sixth graders, in groups, are given different parts of the whole project. They use information from Busch Gardens to explore line graphs, averages, and other math vocabulary.
DiscoverE
LIDAR: Mapping with Lasers
We would be lost without maps! How are they made? Introduce junior topographers to LIDAR technology with a fascinating activity. Set up a mock city, then have learners operate a laser measure to determine the shape of the landscape using...
Curated OER
Mathemafish Population
It's shark week! In this problem, young mathematically minded marine biologists need to study the fish population by analyzing data over time. The emphasis is on understanding the average rate of change of the population and drawing...
Code.org
Sending Numbers
Binary graphing ... bit by bit. Pairs work together to develop a protocol in order to send the points of a graph. One partner sends the points and the other receives them and tries to recreate the graph. The pupils use the rubric to...
Natinal Math + Science Initative
Slope Investigation
Context is the key to understanding slope. A real-world application of slope uses a weight loss scenario with a constant rate of change to introduce the concept of slope of a line, before it makes a connection to the ordered pairs...
Curated OER
Simple Harmonic Motion
Back and forth, and back again. A presentation on harmonic motion would make a great backdrop for a directed instruction lesson in Honors Physics. It includes diagrams, formulas, graphs, and a few sample problems.
Charleston School District
Sketching a Piecewise Function
How do you combine linear and nonlinear functions? You piece them together! The lesson begins by analyzing given linear piecewise functions and then introduces nonlinear parts. Then the process is reversed to create graphs from given...


