Beyond Benign
Municipal Waste Generation
Statistically, waste may become a problem in the future if people do not take action. Using their knowledge of statistics and data representation, pupils take a look at the idea of waste generation. The four-part unit has class members...
K-5 Math Teaching Resources
Graph Paper
You'll never have to buy graph paper again with this printable resource, which can be used for anything from creating graphs, plotting points in the coordinate plane, or measuring the area and perimeter of polygons. A...
Kuta Software
Equations in Standard Form - Solving Systems by Graphing
Get to graphing and figure out the solution between two lines using this 14-problem worksheet. Graphs are provided for the first eight problems, but requires learners to graph the remaining six separately.
CK-12 Foundation
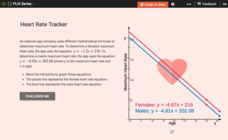
Graphs of Linear Systems: Heart Rate Tracker
Max out heart rates for males and females. Formulas of maximum heart rates provide the equations for a linear system. Pupils use the interactive to graph the equations for males and females and determine their points of intersection. The...
Curated OER
Regents High School Examination: Living Environment 2003
The living environment, from the interior of a cell to the complex relationships among populations, are queried in this final examination. Learners look at air pollution maps, diagrams of cells, population graphs, and drawing of cells....
Curated OER
Regents High School Examination: Living Environment 2007
Environmental science enthusiasts show what they know at the end of the year by taking this full-fledged final exam. They answer multiple choice, graph interpretation, and essay analysys questions, 73 of them in all. Topics range from...
Curated OER
Usage and Interpretation of Graphs
Students explore graphing. For this graphing lesson, students predict how many shoe eyelets are present in the classroom. Students count eyelets and work in groups to organize and chart the data collected. Students put all the data...
Curated OER
Graph it!
Sixth graders view a Stacked Graph, and discuss what it shows. Students discuss the basics of graphing: labels, intervals, legends x and y axis... Students create individual stacked graphs from provided information. Students view a...
Curated OER
Interpreting Data and Statistics using Graphs
Seventh graders interpret data. In this lesson on types of graphs, 7th graders construct, interpret, and analyze different graphs. This lesson includes worksheets and resources.
Curated OER
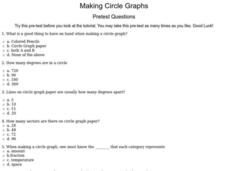
Making Circle Graphs
In this circle graphing worksheet, 6th graders answer ten multiple choice questions based on their knowledge of circle graphs. This is an interactive worksheet.
Curated OER
Line of Best Fit
In this line of best fit activity, students solve and complete 8 different problems that include plotting and creating their own lines of best fit on a graph. First, they study the samples at the top and plot the ordered pairs given on...
Curated OER
Point-Slope Form of a Line
This activity helps young mathematicians connect the graph and the point-slope form of a line, by first solving a real-world problem and then using that example to motivate the understanding of the equation. By manipulating the gizmo,...
Curated OER
Worksheet 2: Graphs, Functions and Derivatives
In this math worksheet, students answer 7 questions having to do with graphing derivatives of functions, rectilinear motion, speed and distance.
Beacon Learning Center
Line Plots
Introduce line plots, show examples of tables, graphing on a number line, and engage in a class discussion. Share the process by which statistical data is organized and displayed on a number line. Examples and worksheets are included....
Curated OER
Read My Bar Graph!
Elementary schoolers make and use bar graphs to picture information. They learn how choosing the right scale for a bar graph can help make a persuasive argument. This is a terrific lesson on graphing which should excite your kids. There...
Curated OER
Bar Graphs
Introduce scholars to bar graphs and data analysis through analyzing these visual examples. First, they look at a pictograph of fruit types and answer five observation questions. There is one done for them as an example. Learners do the...
NTTI
Line 'Em Up!
Coordinate planes and Cartesian graphing systems are the focus of this math lesson. Learners use video, internet activities, and engage in hands-on activities in order to explore coordinate planes. The materials needed for this lesson...
Curated OER
Creating Line Graphs
Students relate data to coordinate graphs and plot points on this graph. They use minimum wage data to construct the graph. Students decide appropriate time intervals for the graphs. They share graphs with their classmates.
Curated OER
Functions and Graphing
Graphing functions in a real world application makes math come to life. Learners graph points on a coordinate plane and identify various points on a graph by working through a set of real world problems. This is a perfect review exercise.
Computer Science Unplugged
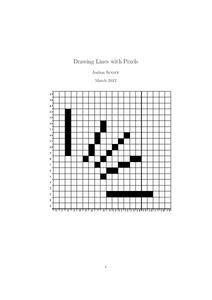
Drawing Lines with Pixels
How do the computers keep it straight? Using the provided algorithms, class members draw a line and a circle using pixels. They then check the drawings using a straight edge and compass to determine the accuracy of their...
Curated OER
Graphing Lines That Don't "Fit"
How can you graph lines that don't seem to fit on the given graph? What makes a line straight? What does the rate of change mean when graphing a line? How do you know if a slope is positive or negative? How do you know if the graph of a...
CK-12 Foundation
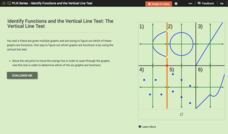
Identify Functions and the Vertical Line Test: The Vertical Line Test
There's no easier test than the vertical line test. Learners drag a vertical line across the graphs of several relations in an interactive. They answer a set of challenge questions that focus on whether the graphs represent functions.
Gatsby Charitable Foundation
Four Activities Using Straight Line Graphs
This math packet includes four different activities which puts linear equations and line of best fit in the context of real world applications. Each activity uses a different linear math modeling equation and asks the learners to...
Curated OER
Use Information in Line, Bar, Circle, and Picture Graphs to Make Comparisons and Predictions
Eighth graders explore the concept of graphs. In this graphs instructional activity, 8th graders compare and contrast picture graphs, bar graphs, line graphs, and circle graphs. Students examine each type of graph and answer questions...


