Curated OER
Mmm, Mmm, M&M's
Here is another version of the classic M&M math lesson. In this one, upper graders utilize the ClarisWorks Spreadsheet program in order to document the data they come up with from their bags of M&M's. After making their initial...
Curated OER
Endangered Species
Ninth graders graph data in order to compare the number of extinct species and a rise in human population. They analyze the data collected. Students are encouraged to infer the relationship.
Curated OER
Creating Climographs
Students chart statistical information on graphs, interpret the information and use it to explain spatial relationships, and identify the relationship between climate and vegetation.
Curated OER
Death by Particles
Emerging epidemiologists define relative risk and read an article about the effect of particulate pollution on the cardiovascular health of women. They record the relative risk values, graph them, and answer analysis questions. This is a...
Curated OER
Fame, Fortune, and Philanthropy
With your middle schoolers, develop concepts such as philanthropy, civic responsibility, community service, and common good. Discuss famous philanthropists and what we can each give of our time, talent and treasure to better our...
Curated OER
Graphing Grazy Crayons
Children create crazy crayons they made to sort and construct a floor bar graph. Then, using technology resources, they make a simple bar graph to compare the top four colors produced. Students will then interpret the printed graph by...
Curated OER
Making Estimations in Measurement
Students utilize their knowledge of measurement in making accurate measurements and estimations.
Curated OER
More preparation for the Picture Project
Students graph linear equations and make a poster. In this algebra lesson, students write the equation of a line, and identify the domain or x-value of the graph. They create picture for their project.
Math Worksheet Center
Linear Quadratic Systems
In this linear quadratic system worksheet, students explore a system with a linear and a quadratic equation. With the given equations, students graph the parabola. They identify the axis of symmetry, the slope, points of intersection,...
Curated OER
Integrated Algebra
In this integrated algebra worksheet, learners solve problems covering topics studied during the year. Problems include topics such as slope-intercept, Venn Diagrams, finding the solution to multi-step algebra problems, writing...
Curated OER
Integers
Students graph integers on a number line. In this integers lesson, students create a colored foldable to assist them with notetaking and problem solving. Students complete exercises from text.
Curated OER
Using Symmetry to Find the Vertex of a Parabola
Learners engage in a lesson that is about finding the vertex of a parabola while using symmetry. They use the symmetry to find out where the two lines meet. The line is displayed with the help of a graphing calculator. The lesson...
Curated OER
Chapter 3 - Worksheet 3E - Functions
In this function activity, students observe graphs and determine if the function of the graph is odd or even. They find the inverse of a function and determine the horizontal asymptote of a function. This four-page activity contains 24...
Curated OER
Graphing Coordinates
Sixth graders practice graphing coordinates. In this geometry lesson, they use the x and y axis to locate points that must be connected in the right sequence to form a straight line.
Curated OER
Tallies Tell It All
Students explore data collection through the use of tally marks. After a demonstration of the use of tally marks students complete various inquires where they create a chart documenting the number of times a desired result happens. They...
Curated OER
Chapter 10-Relations and Functions, Practice Test
In this intermediate algebra learning exercise, students solve 20 multiple choice problems. Problems range from finding the domain and range of a function to identifying the graph of an inverse of a function.
Curated OER
Cost analysis
In this Algebra I worksheet, 9th graders analyze a problem in which basic assumptions must be made about cost and demand for the product or item. Students use a graph to make predictions and determine the best price at which to...
Curated OER
Let's Plot Points
Use coordinate grid paper to plot points and identify shapes that are already plotted on the paper by saying their coordinates. Pupils also measure the distance between points and play the game Battleship. There are several web links and...
Bowland
Alien Invasion
Win the war of the worlds! Scholars solve a variety of problems related to an alien invasion. They determine where spaceships have landed on a coordinate map, devise a plan to avoid the aliens, observe the aliens, and break a code to...
CK-12 Foundation
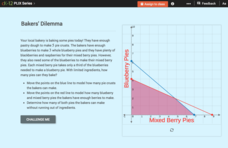
Linear Programming: Bakers' Dilemma
Place the pies in a line. Pupils create a graph of a system of linear inequalities to represent the number of pies a bakery can make. Learners analyze the vertices on the graph to determine the number of pies they can bake without...
Florida Center for Reading Research
Phonological Awareness - Phoneme Segmenting and Blending, Treasure Chest
Working in pairs, scholars use picture cards to practice segmenting words into phonemes and blending phonemes into words. When a peer answers correctly they place a penny in a treasure chest. Incorrect responses make the card go back in...
Curated OER
Ornithology and Real World Science
Double click that mouse because you just found an amazing lesson! This cross-curricular Ornithology lesson incorporates literature, writing, reading informational text, data collection, scientific inquiry, Internet research, art, and...
Los Angeles County Office of Education
Assessment for the California Mathematics Standards Grade 7
In need of an all-inclusive seventh grade math resource? Packed full of the topics necessary for Pre-Algebra the packet includes practice problems with different difficulty levels. It works great for any supplemental use needed...
Curated OER
Exploring Linear Equations: Student Worksheet
An activity around linear equations, slope, and intercept is here for you. In it, young mathematicians engage in a whole-class activity while the teacher uses the overhead projector graphing calculator. This activity also focuses on...


